Hi there,
First of all, I discovered Nodebox only a few days ago and must say, I am a big fan. I have been using grasshopper for rhino for a few years now and really enjoy your tutorials because they rely much more on data imput. Grasshopper having a python component, it could be interesting to see a porting of nodebox into grasshopper :)
Any ways, my situation is this:
To start understanding workflow in data visualization, I followed the zipmap tutorial. I then moved on to try to work out how to take it from the last point of the tutorial to the example with the colors (in the given examples/topic section).
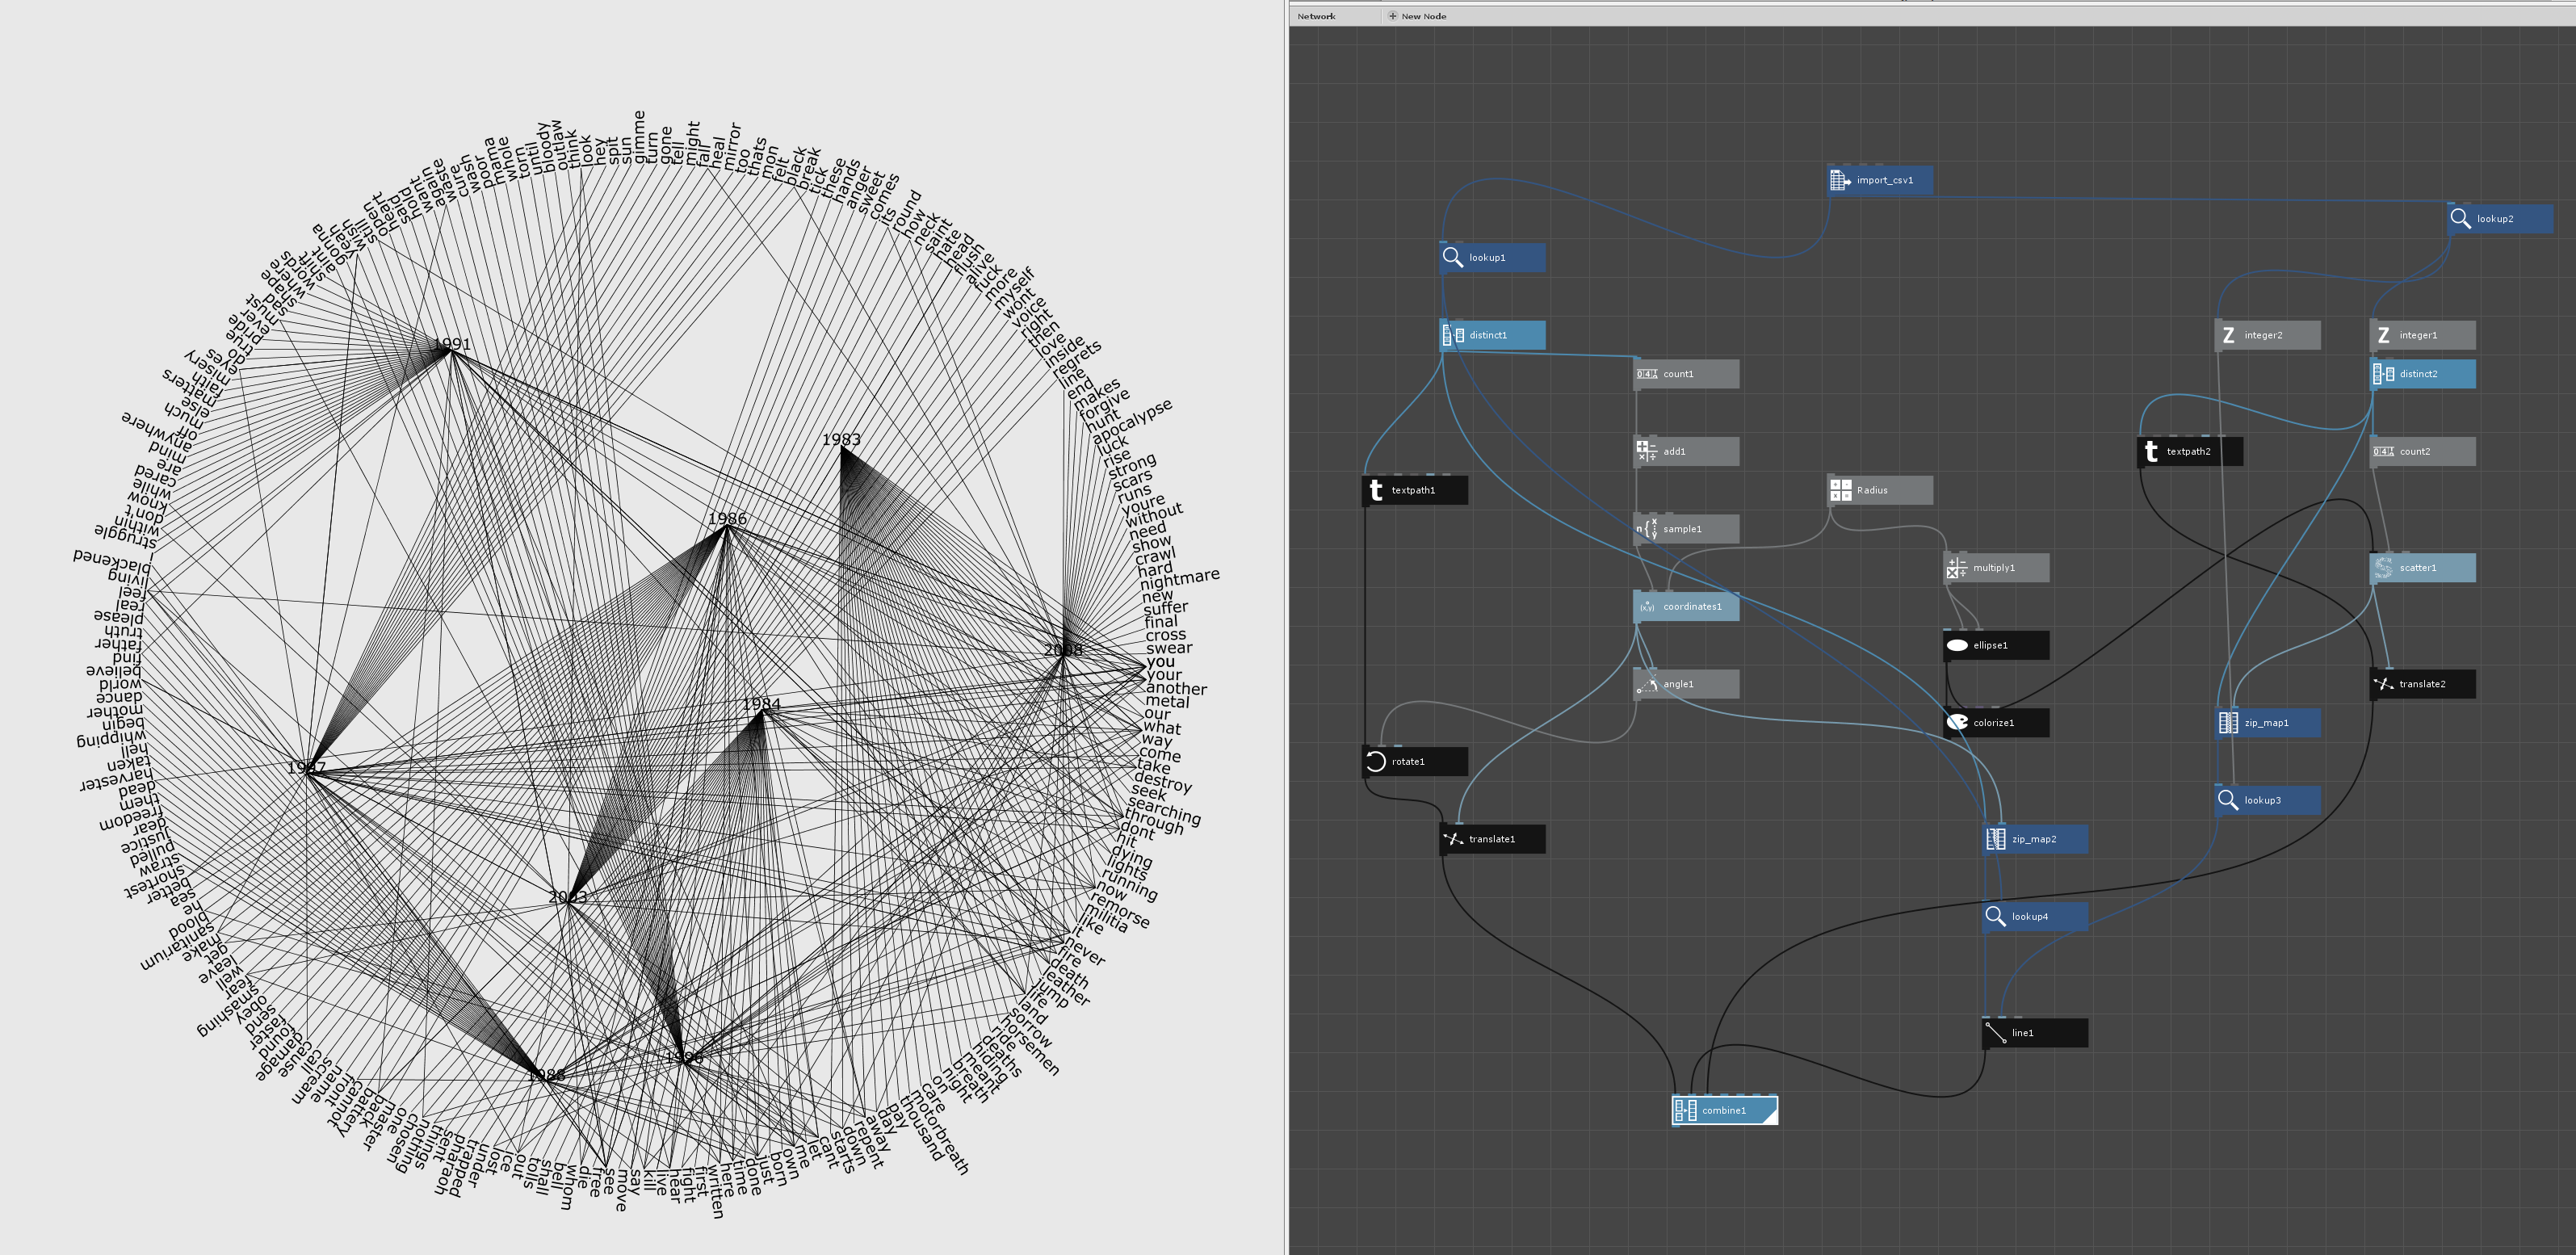
After a lot of head scratching, I kinda got my head around zipmapping and tried to write the example on my own. I came up with a visual that in my mind makes more sense than the one your example comes up with :
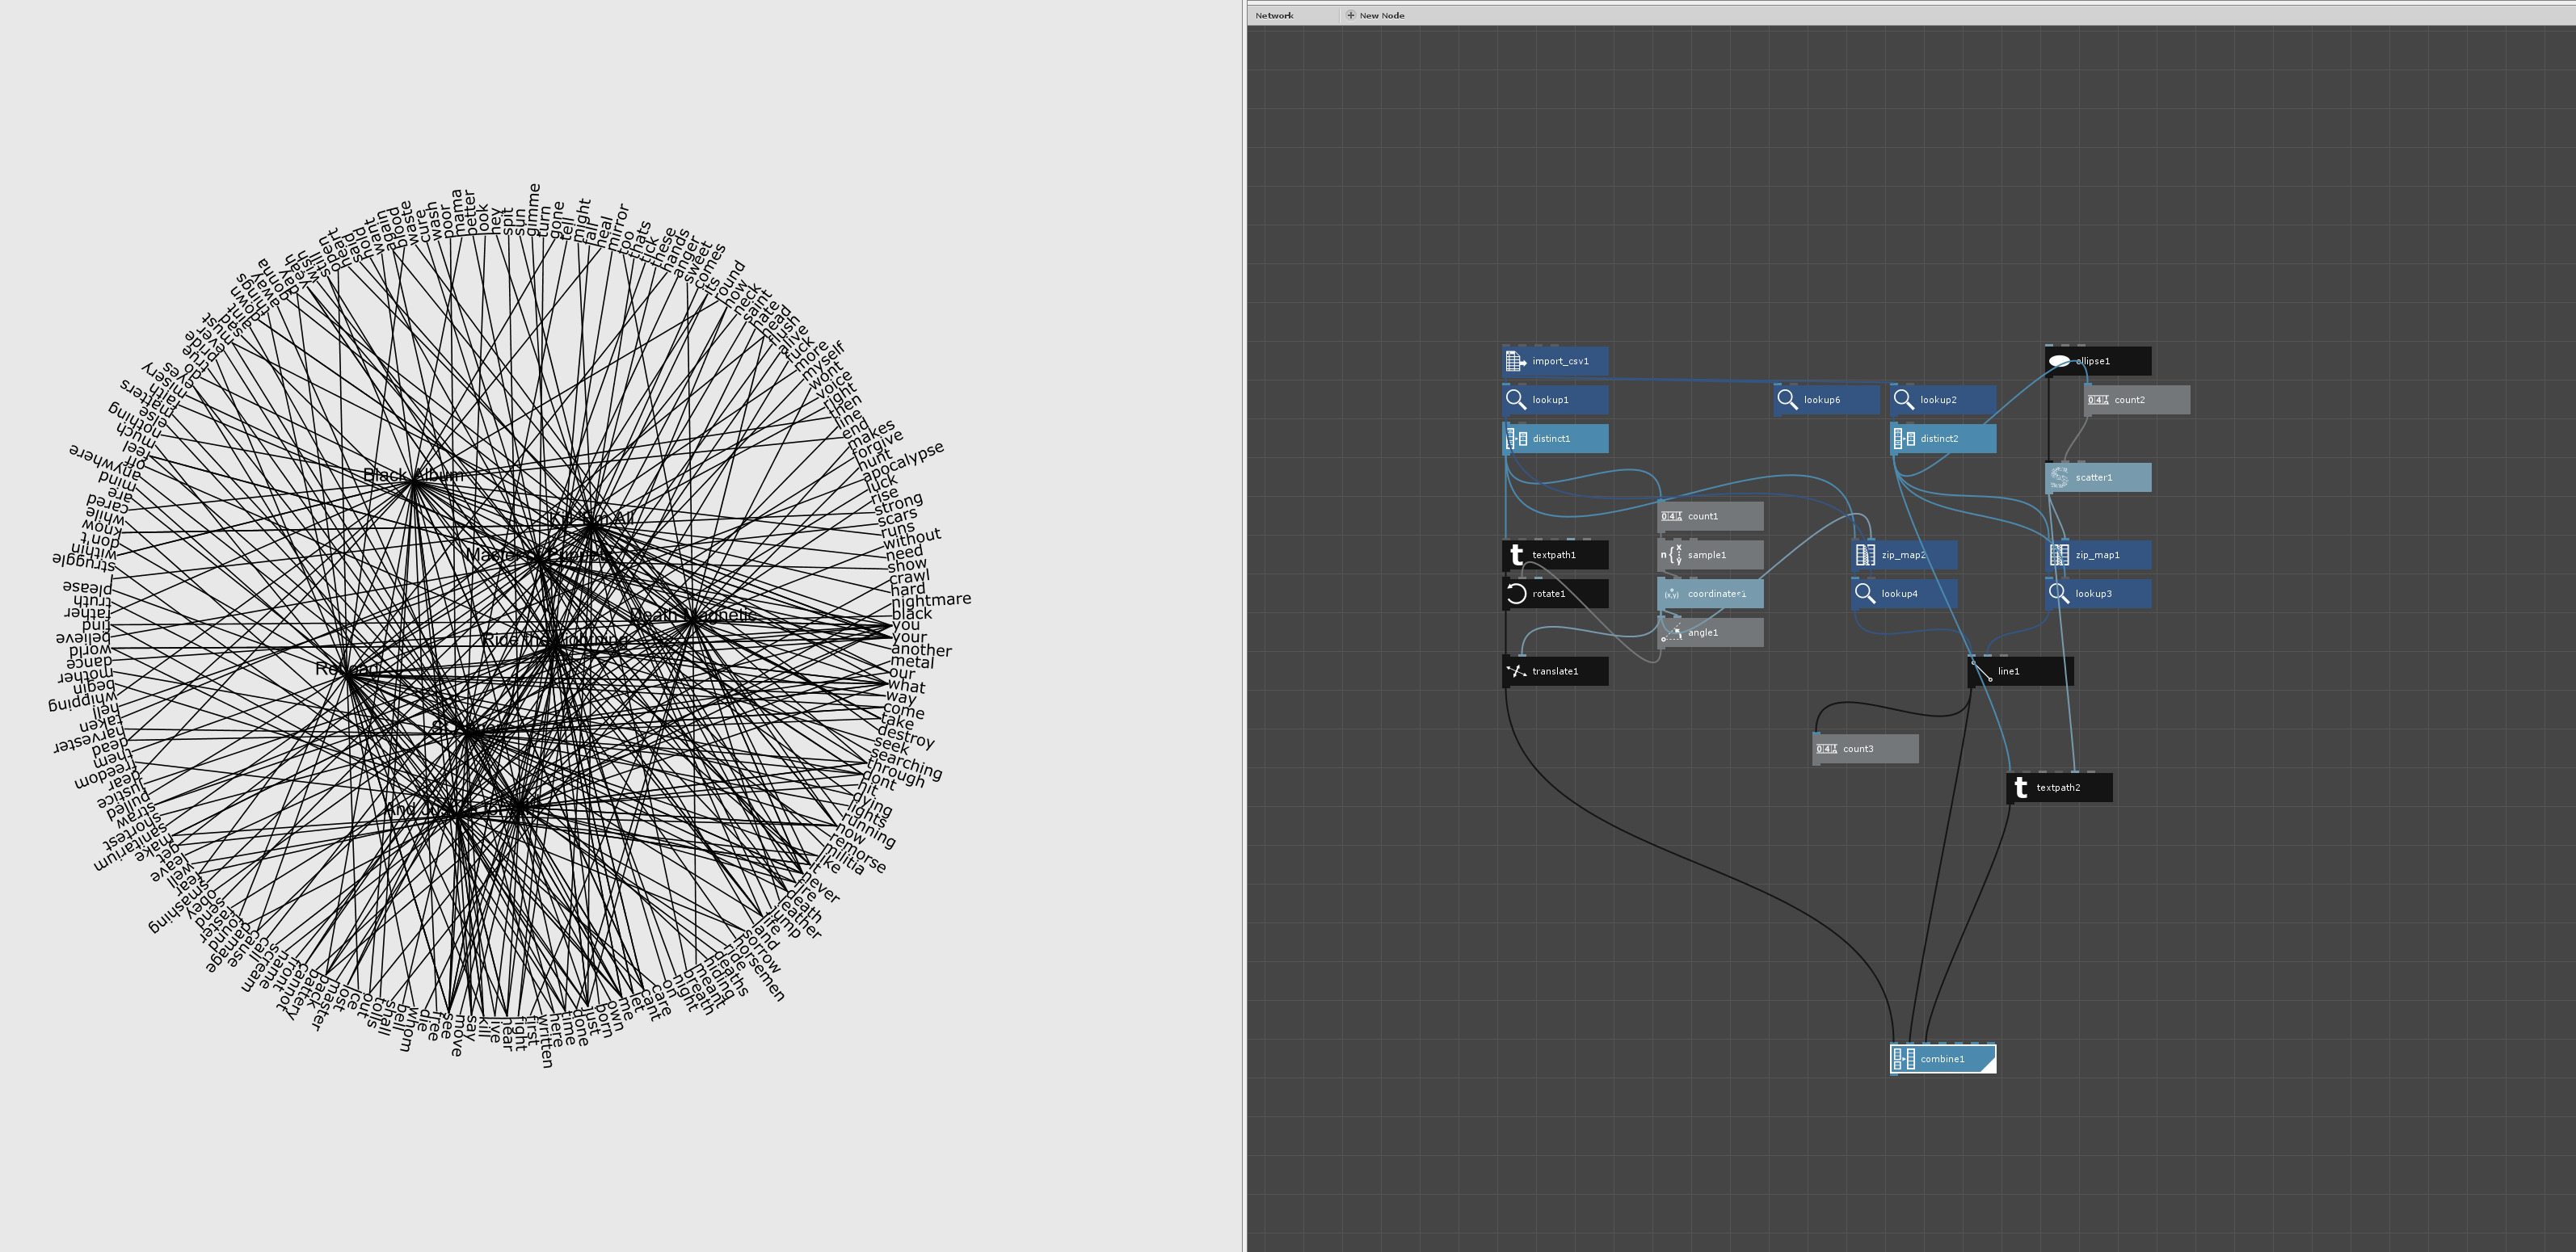
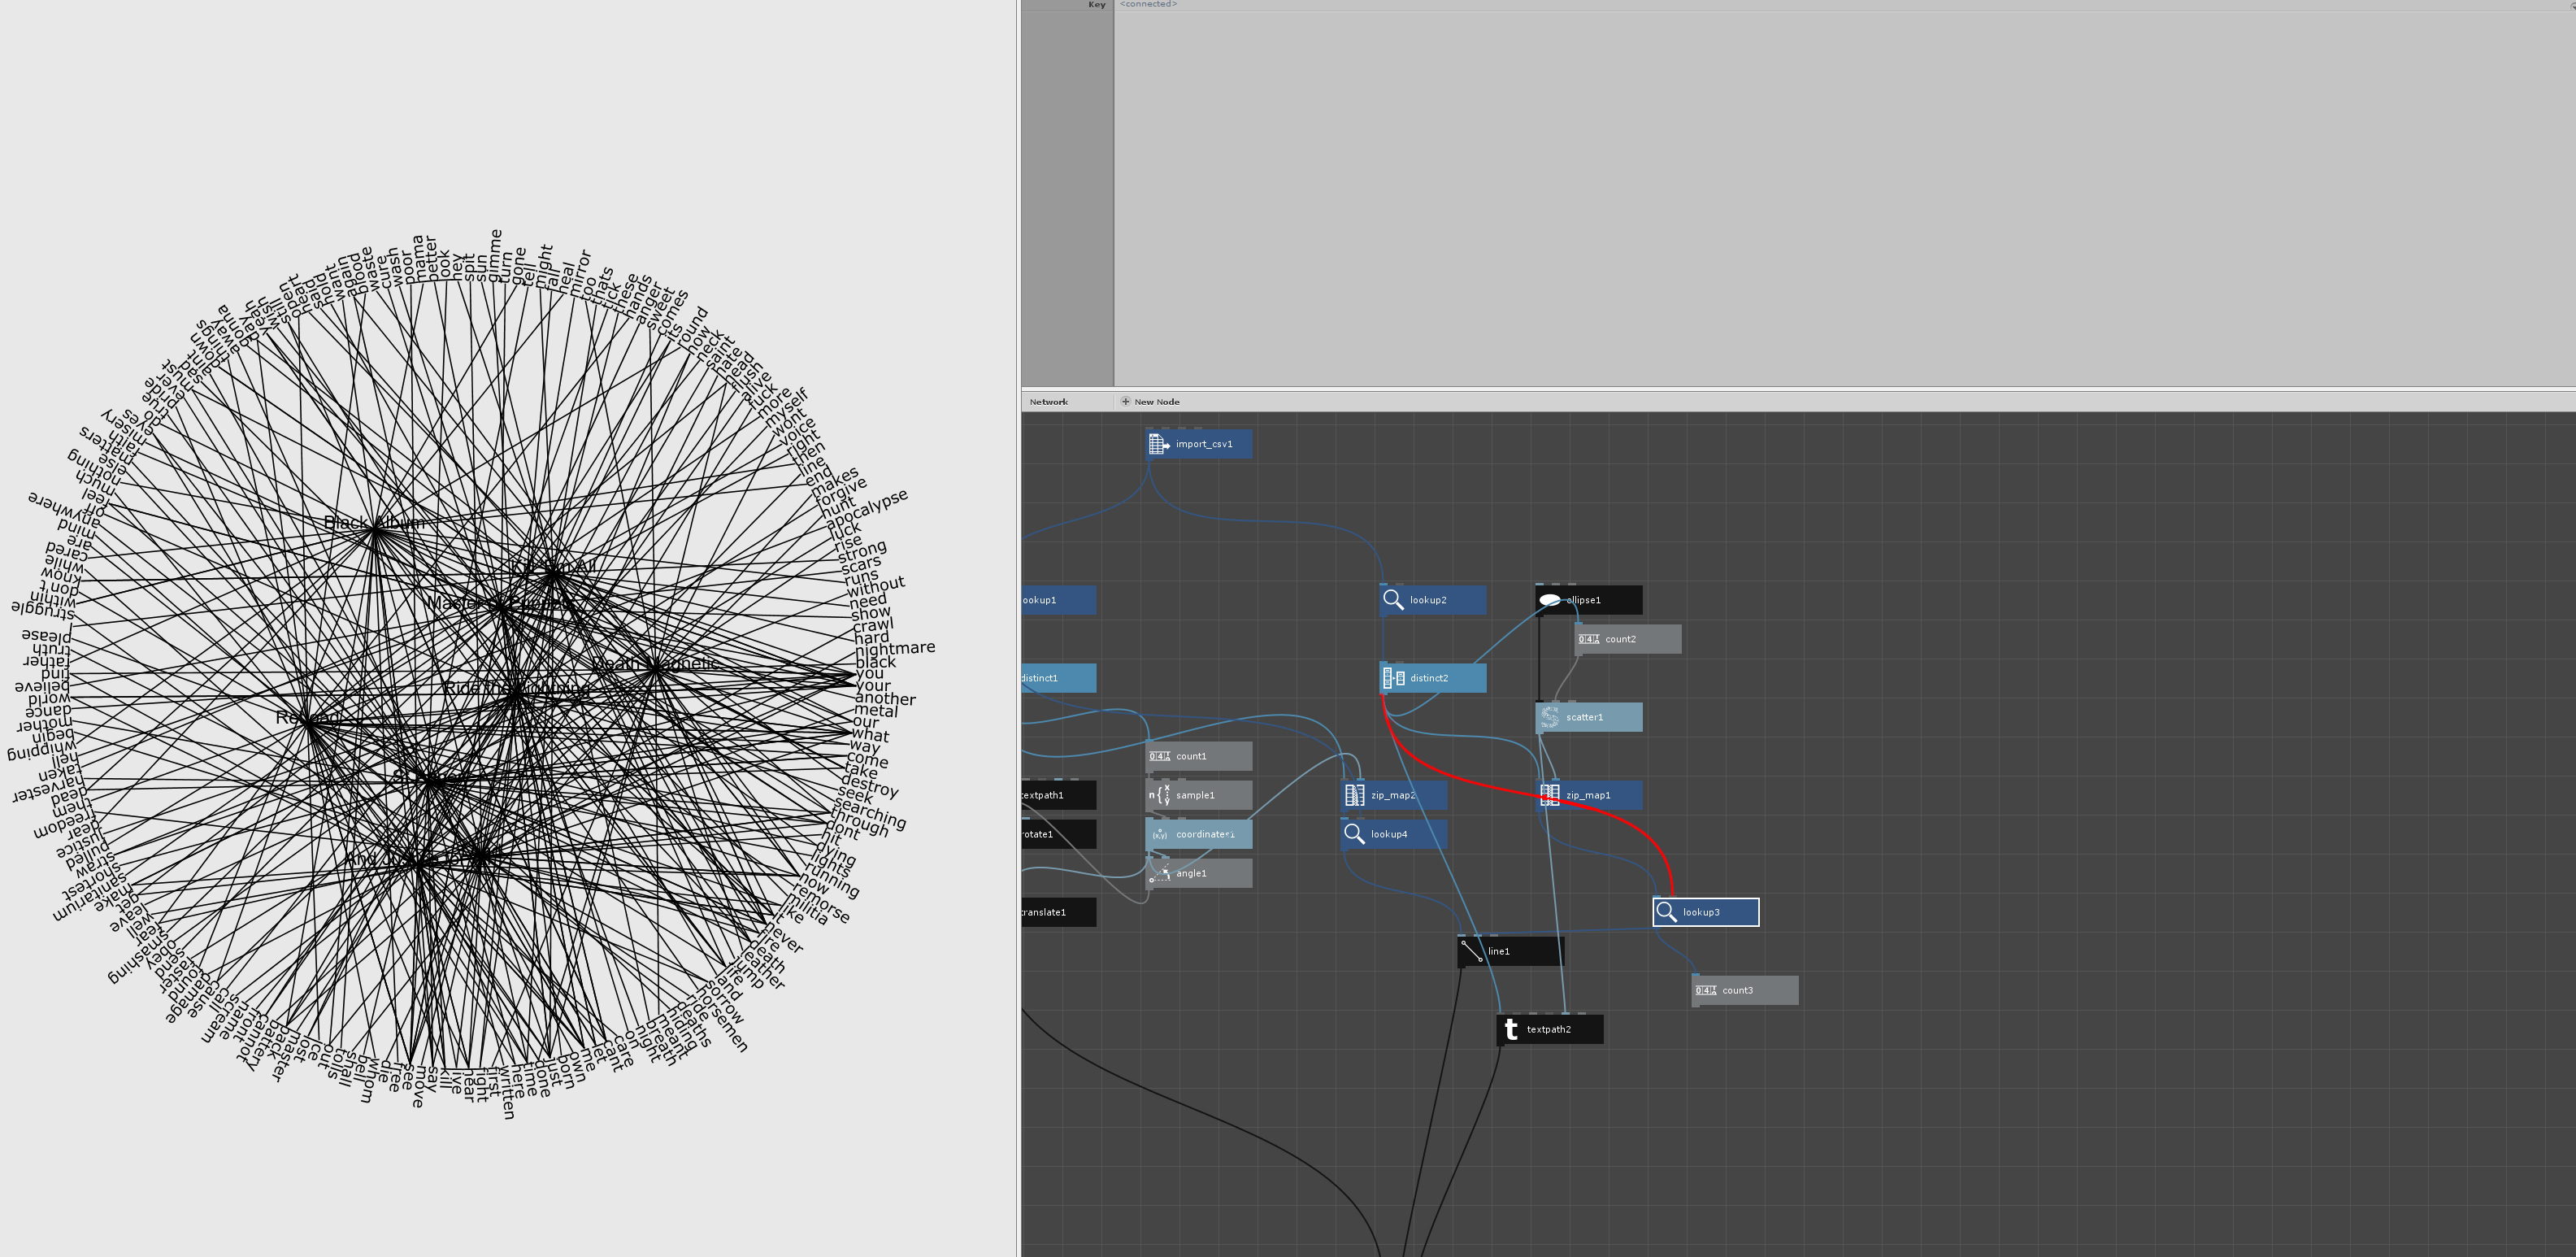
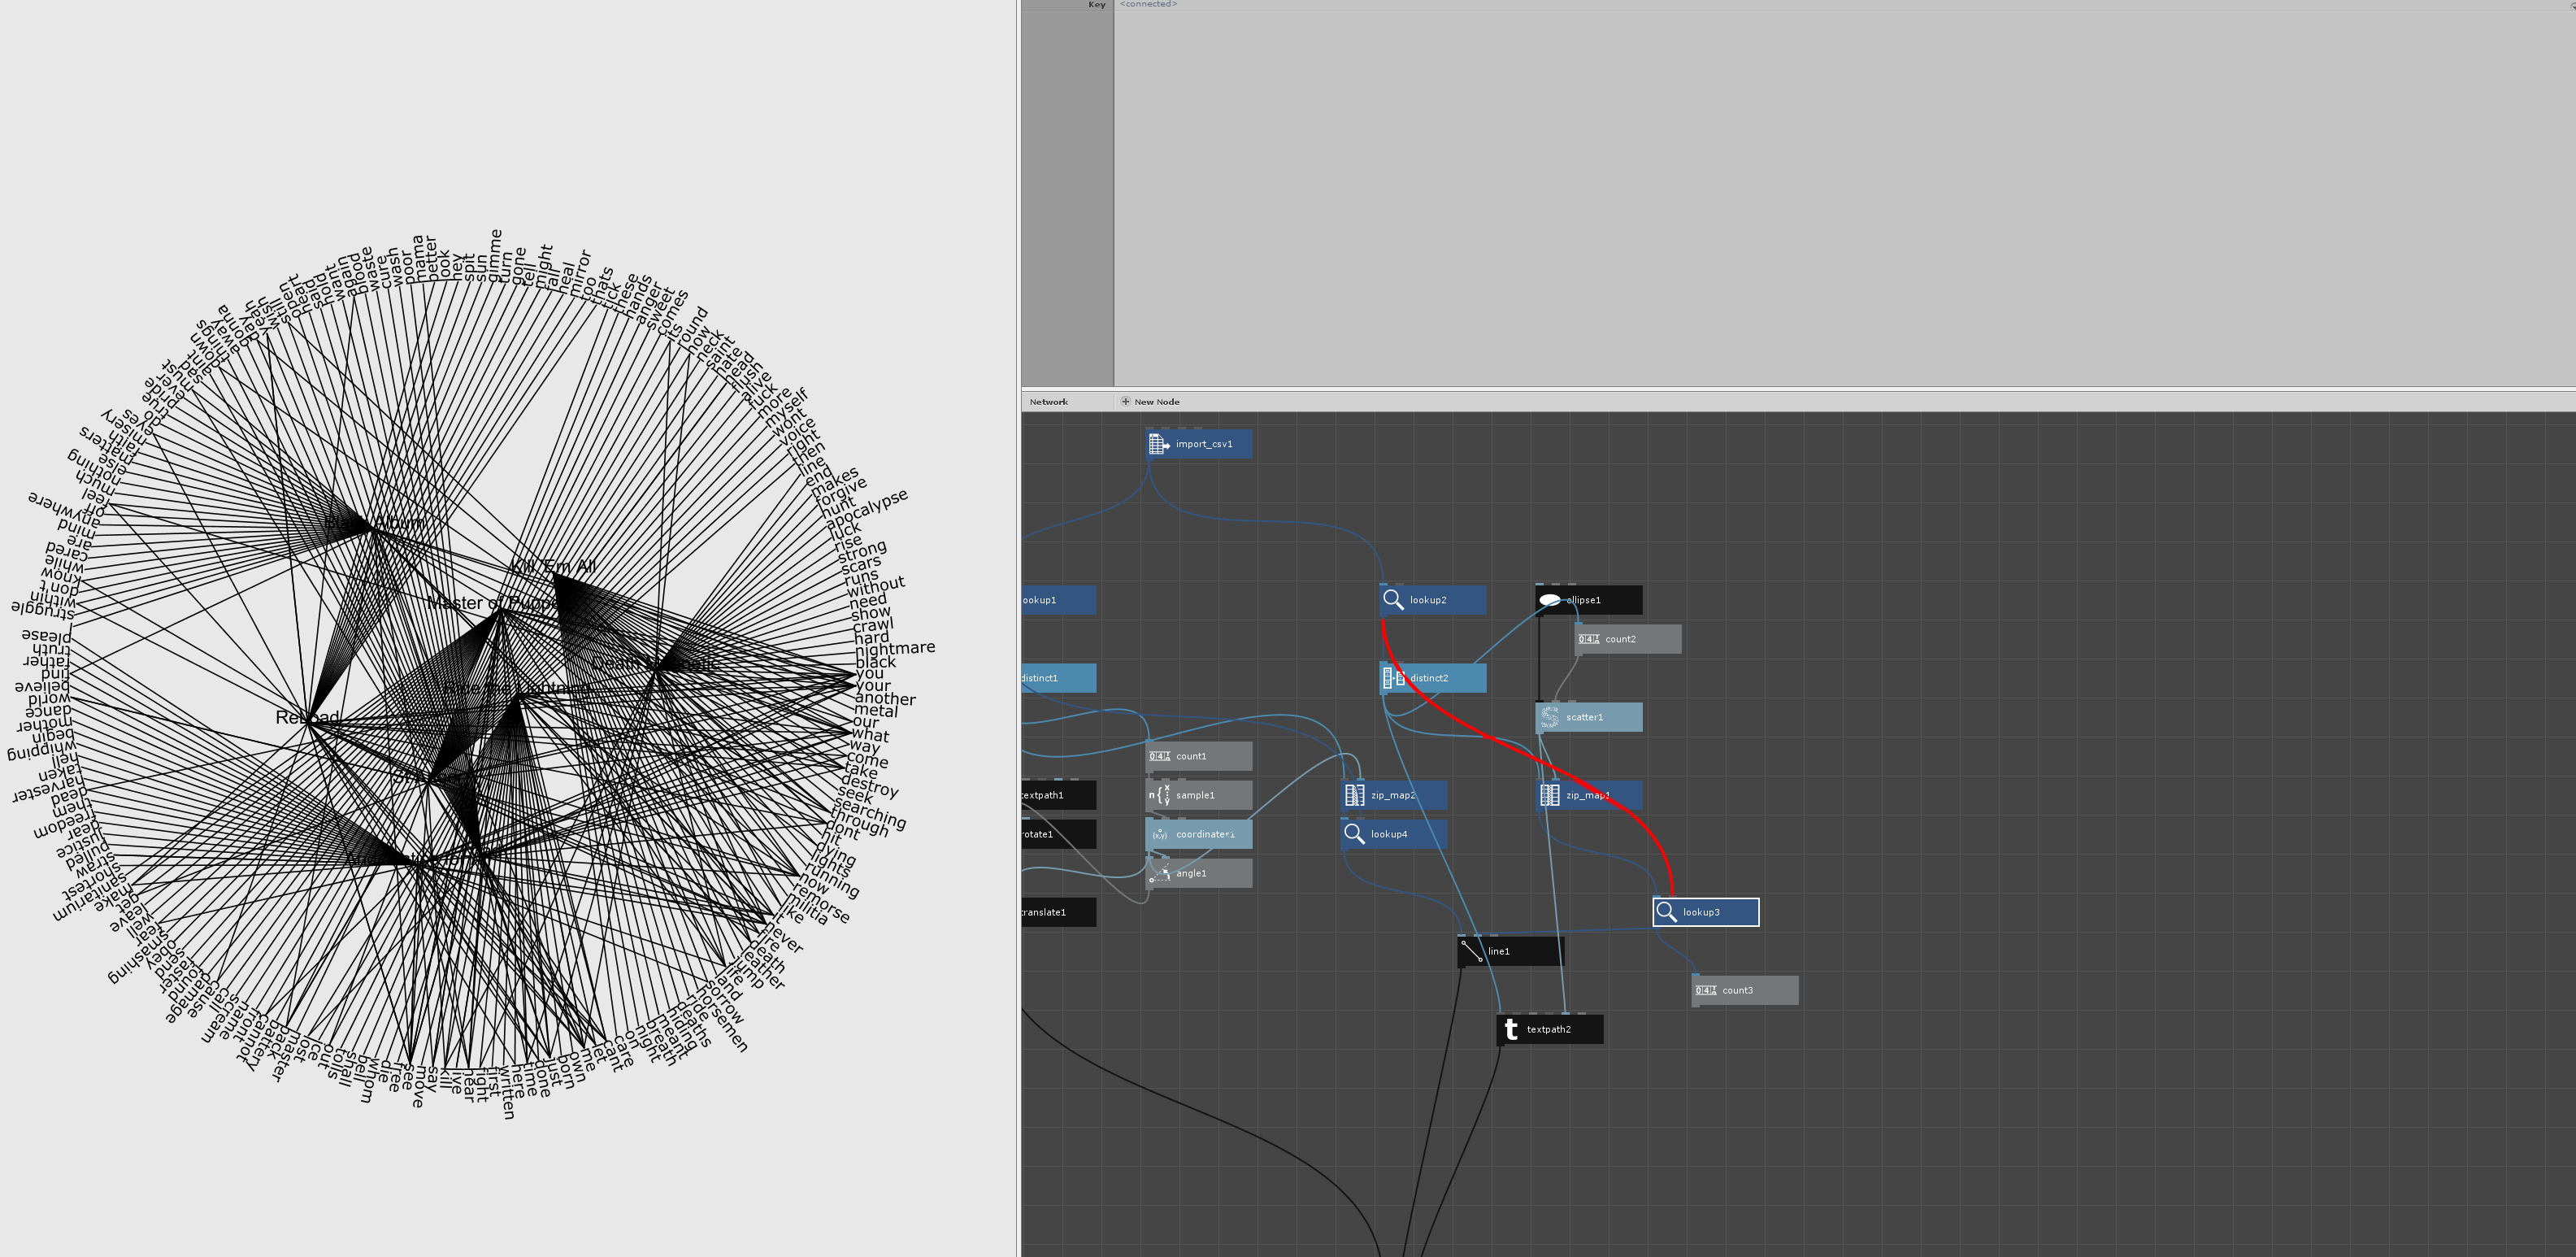
In the CSV file, the list is organised by frequency per album, so one album follows the next one. In my visual this clearly shows: all the words in the circle follow that list so one year/album point creates a regular fan to its section of the circle + a couple of other strings that dont fit into the fan because duplicates have been removed. In your example however, the points appear to connect much more randomly with their allocated words in the circle. Looking at the nodes, I don't really get it as it seems that we followed the same zipmapping process.
Hopefully you can make sense of what I am saying and tell me what I am missing or not understanding properly.
PS: I added a count to your lines and it ends up with 360, I cant make a sense of that number too since the list is 442 long or 248 without the duplicate words.
Cheers,
David