Hey everyone!
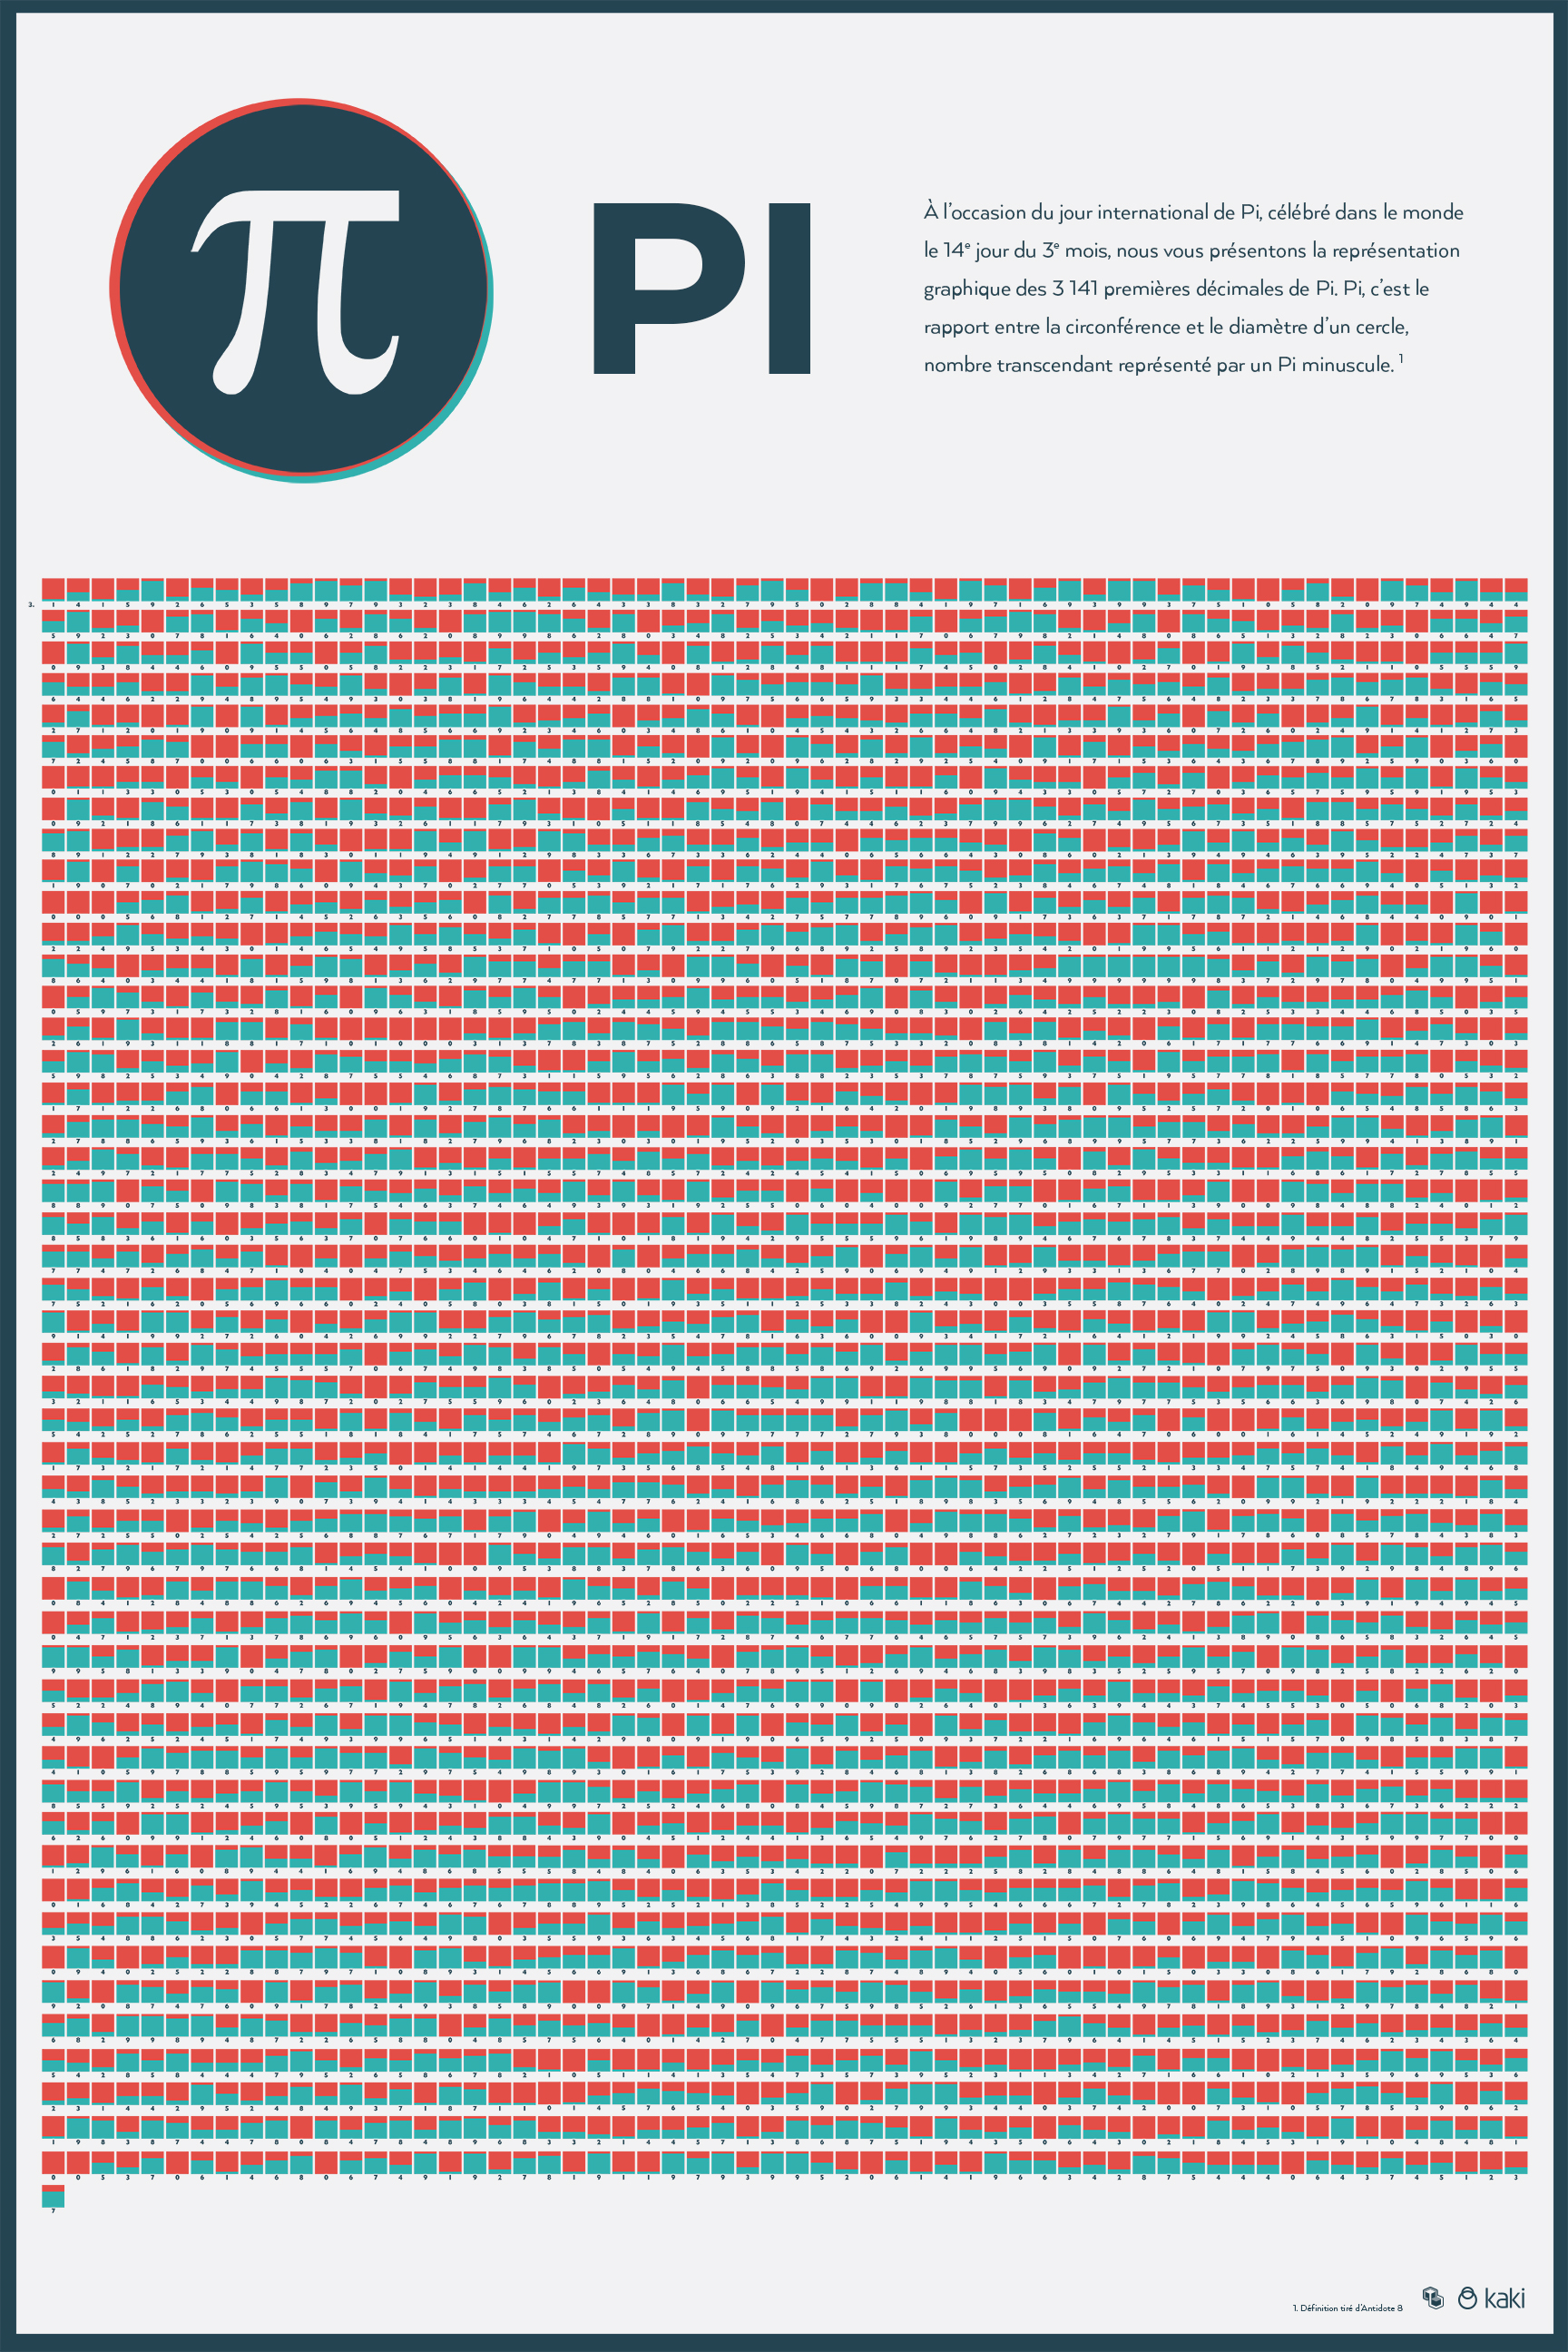
I followed the Montreal Workshop last year and I always search for excuses to use NodeBox in my work. The last excuse that I used to create something with the software is the International Pi Day which is Marc 14th (3/14). I only had about 3 hours to find the data, clear them (because I was not going to do the poster for 1 000 000 digits), make the programming of the nodes and the poster that comes out of it, so it is a simple histogram to visually represent the famous mathematical constant.
So I truly hope that you'll enjoy what I've done and that it will help to spread the words on this useful tool that is NodeBox.
Sincerely
Benjamin Loiselle