The new NodeBox forum is live! Everything from support.nodebox.net moved here: sign in with the same email to pick up your old posts. Something not working? Write to forum-support@nodebox.net.
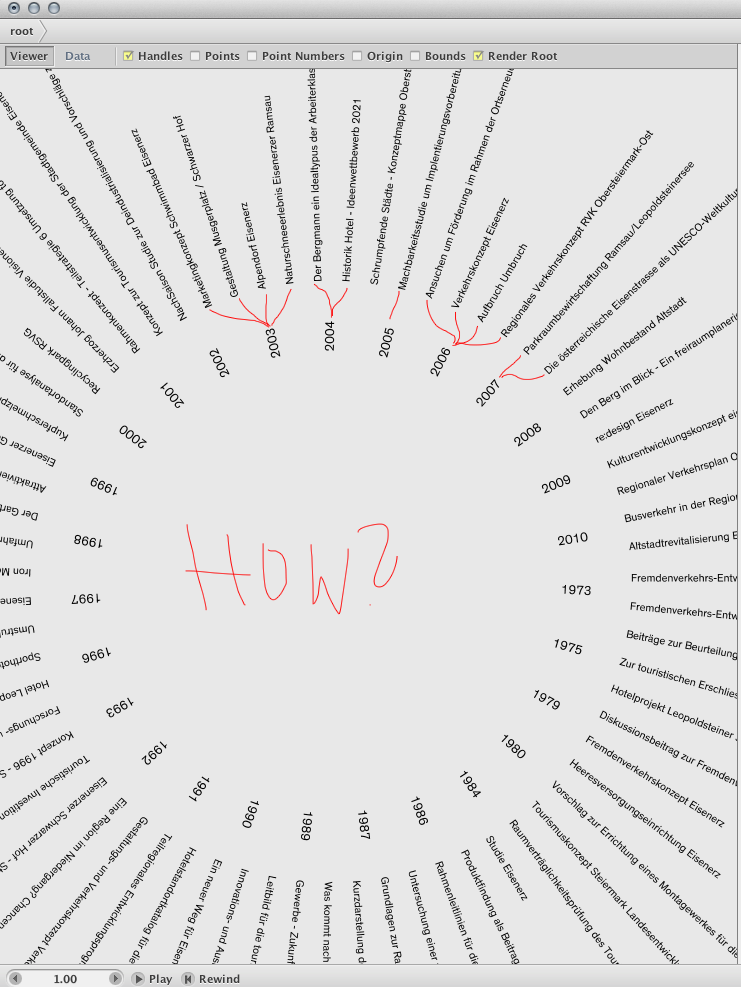
I am playing around Nodebox 3 for 2 days now. Generally I want to use it for data visualizations of studies made in Austria.
The problem is when I connect the different datasets (year - line - name of the study) I get a chaos but I want simple
branches from each year to the according study made in this year. What am I making wrong. Pleas help me.
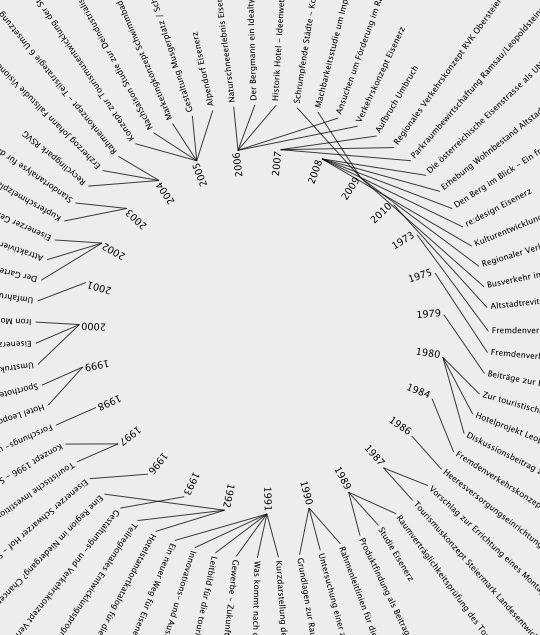
Hi you forgot to do a lookup of the point belonging to the year for every title. I added the necessary nodes to make this happen. I also rotated the years a bit around, so the lines would be less chaotic.