The new NodeBox forum is live! Everything from support.nodebox.net moved here: sign in with the same email to pick up your old posts. Something not working? Write to forum-support@nodebox.net.
I am trying to visualise this data as an arc diagram (something similar to this http://nodebox.net/node/documentation/using/xdata-visualization-metallicd.png.pagespeed.ic.9vEv0p27ch.png in the Creating Data Visualisations page), where the data is in the shape of a circle, and arcs show the links between my data. I am having difficulty in linking the data, due to the nature of the relationship. This is because a concept appears in a number of papers, yet a paper has also a number of different concepts.
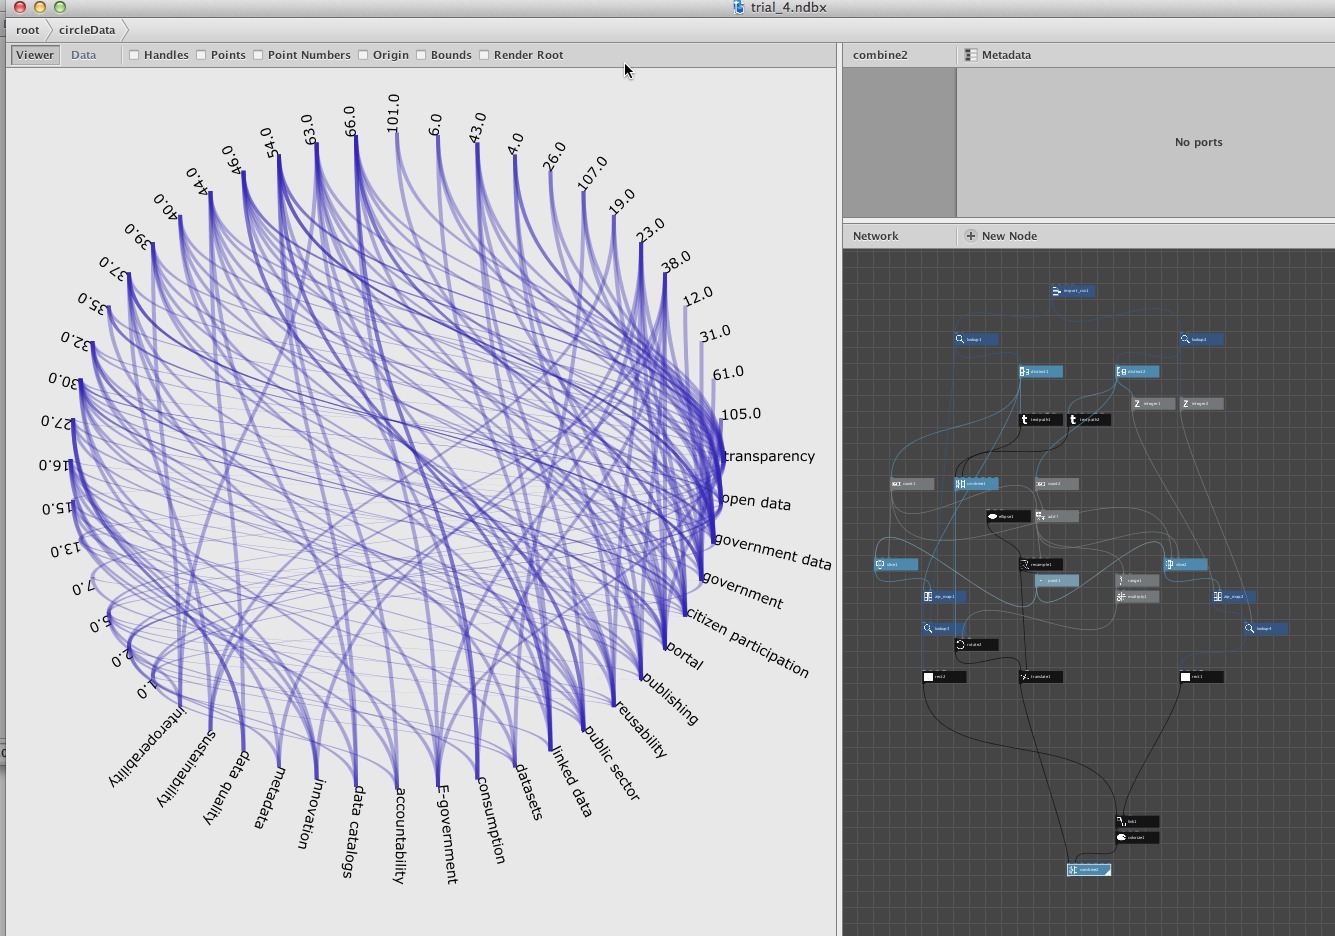
Okay, I'm not sure if it is what you want but at least it reduces the amount of shapes you were generating. Because you used all the points of the text paths NodeBox was generating more than 100000 shapes (through list matching) I assigned the points of where the elements reside on the circle and then sliced the list according the amount of data. So each part of your data has its segment on the circle. Then through your zip map you can connect the rectangles you put on those points. Anyway have a look at the attached file.
grtz,
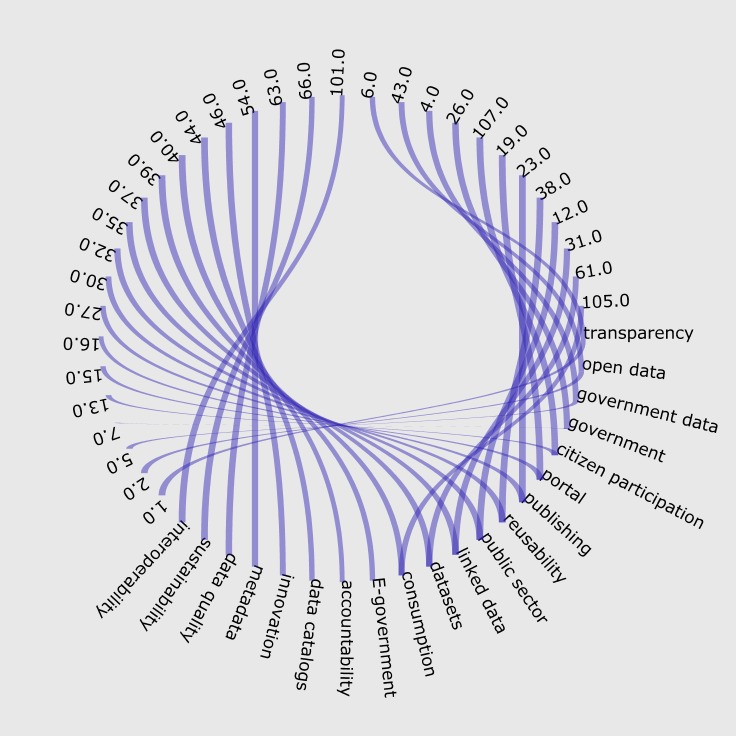
The visualisation is exactly how I require it to be, however the original problem of the actual links is still here. I tried using a zip_map using a small set of data, however it is still not being mapped correctly. For example, as you can see "6" is not being linked to any concept, even though it is in the data. "innovation" is also linked with the wrong numbers.
Sorry, I did not check the file well enough! Attached is the solution you want. Your zipmaps were wrong. Basically I zipmapped for having two lists of points, which then are linked.