Hi,
This my very first visual success in using Nodebox for datavisualization.
Hope you'll enjoy ;)
OB.
The new NodeBox forum is live! Everything from support.nodebox.net moved here: sign in with the same email to pick up your old posts. Something not working? Write to forum-support@nodebox.net.
Show your WorkFrom the old forum
Hi,
This my very first visual success in using Nodebox for datavisualization.
Hope you'll enjoy ;)
OB.
Olivier,
Nice! Elegant, clean, simple, dramatic. Good use of NodeBox's strengths.
I like your color ramp. Did you use the similar string counter as part of your calculations?
You are using two modalities, color and arc-length, to describe the same quantity. This is fine and contributes to the overall effect. But it would be interesting to use color to visualize a different dimension like population, average income, distance from Strasbourg, etc. This might reveal some surprising correlations.
Thanks for sharing!
John
Thanks John!
This visualization is very simple. Not very familiar with data and programming, I'm still learning to walk step-by-step with Nodebox and data crossings. Your advices are precious, I hope show you something more interesting very soon ;)
I did not use similar string counter for this creation. I used it with some (visual) success for a graphical internal meeting report. As you can see attached, your counter (still black magic for me ;) was involved in the creation of subchapters mentioned in red and green rings. Thank you again, it's a very useful tool. I encourage you to implement it in a next version of Nodebox.
I also used this particular node in a more complex version of this project (still a work in progress), that based on a single cvs file.
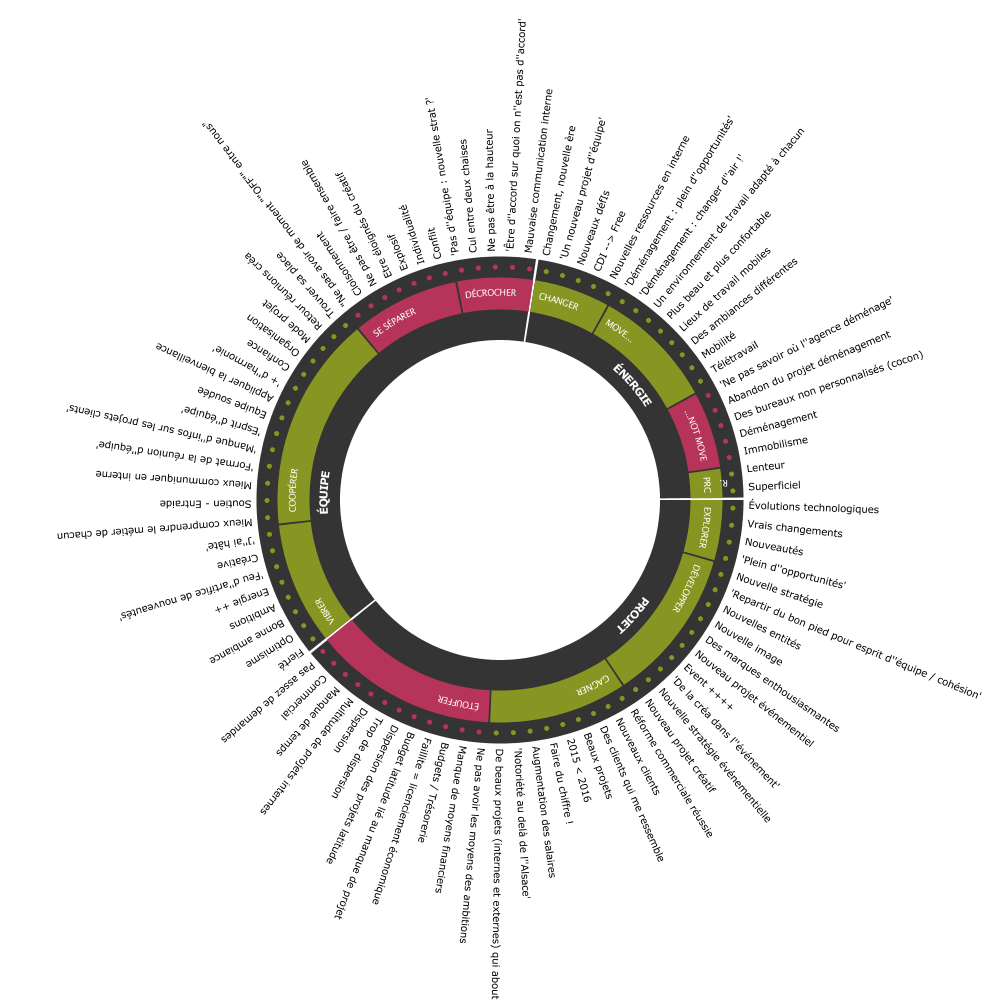
Thanks, Olivier. I'm glad you found it useful.
I like your work. Effective use of NodeBox and nice presentation style.
Incidentally, I am not a member of the NodeBox staff, just another NodeBox user like you. I'd like to see NodeBox continue to develop and prosper so I do what I can to strengthen the NodeBox community. I think the more we post in the forum, the easier it will be for new users to understand and harness the potential of this amazing tool.
John
Olivier, good stuff. It is wonderful to see how you manage to do this without "being familiar with data and programming"!
@John: to us you seem to be part of the crew, thanks for helping out at this forum. We really appreciate!
Lucas
Lucas, i'm really glad that you enjoyed my work. Well, i'm first a graphic and UI designer. So it is easy to put some style into my works. But, I feel often limited with mathematical et programmation encountered issues. I've got some basic algorithmic knowledges, but i never learned Python (and don't want to for now). That's why nodebox 3, and other visual programmation tools are so interesting to me. And that's why also, I ask sometimes to implement new native tools/nodes. Custom nodes sound still like black magic to me ;)
Indeed, thanx for giving support and encouragement.