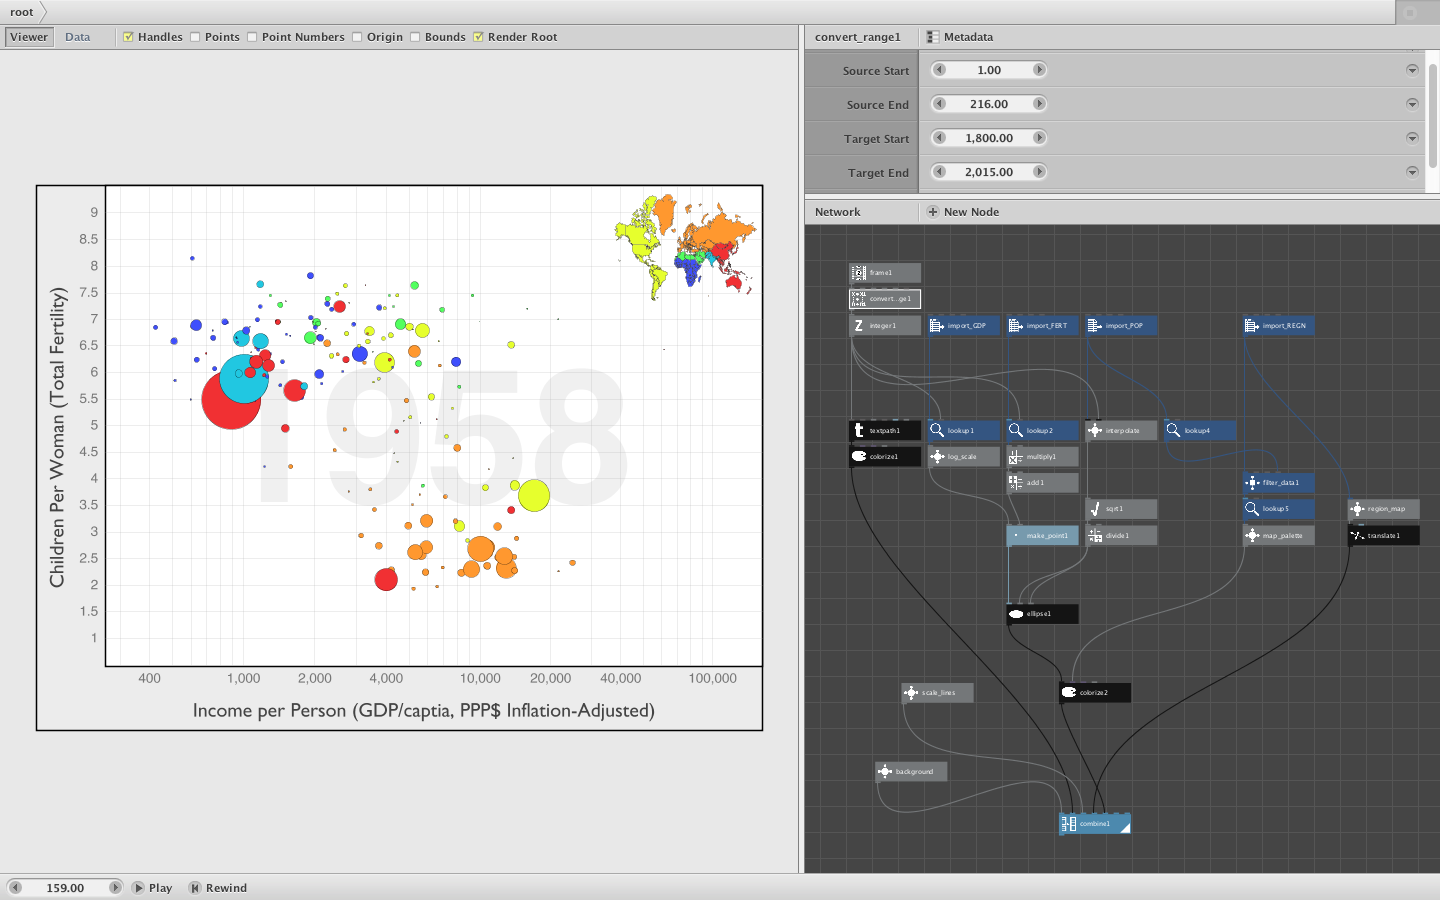
This week's weekend project is a re-creation of Hans Rosling's famous Gapminder visualization. This is one of my favorite visualizations and I just wanted to see if I could make it in NodeBox. For more about Gapminder see
I'm quite pleased with how it turned out and I hope you enjoy it. This visualization displays five dimensions of data (GDP, Fertility, Population, Region, and Time) in a clean and simple way. It has a hopeful message: over the last 200 years you can see a clear movement from misery (high fertility and poverty in the upper left) to a much improved situation in the lower right, with every nation in the world making progress. The nodebox network includes a color-coded world map, a bubble chart with a log scale, an animated timeline, and other features which may be useful to people learning how to visualize data with NodeBox.
I am attaching a screenshot and video showing the progress from 1800 to 2015. The zip file contains my nodebox network, the supporting data files (taken from the Gapminder site), and a READ ME file with attributions and links.
Enjoy!
John