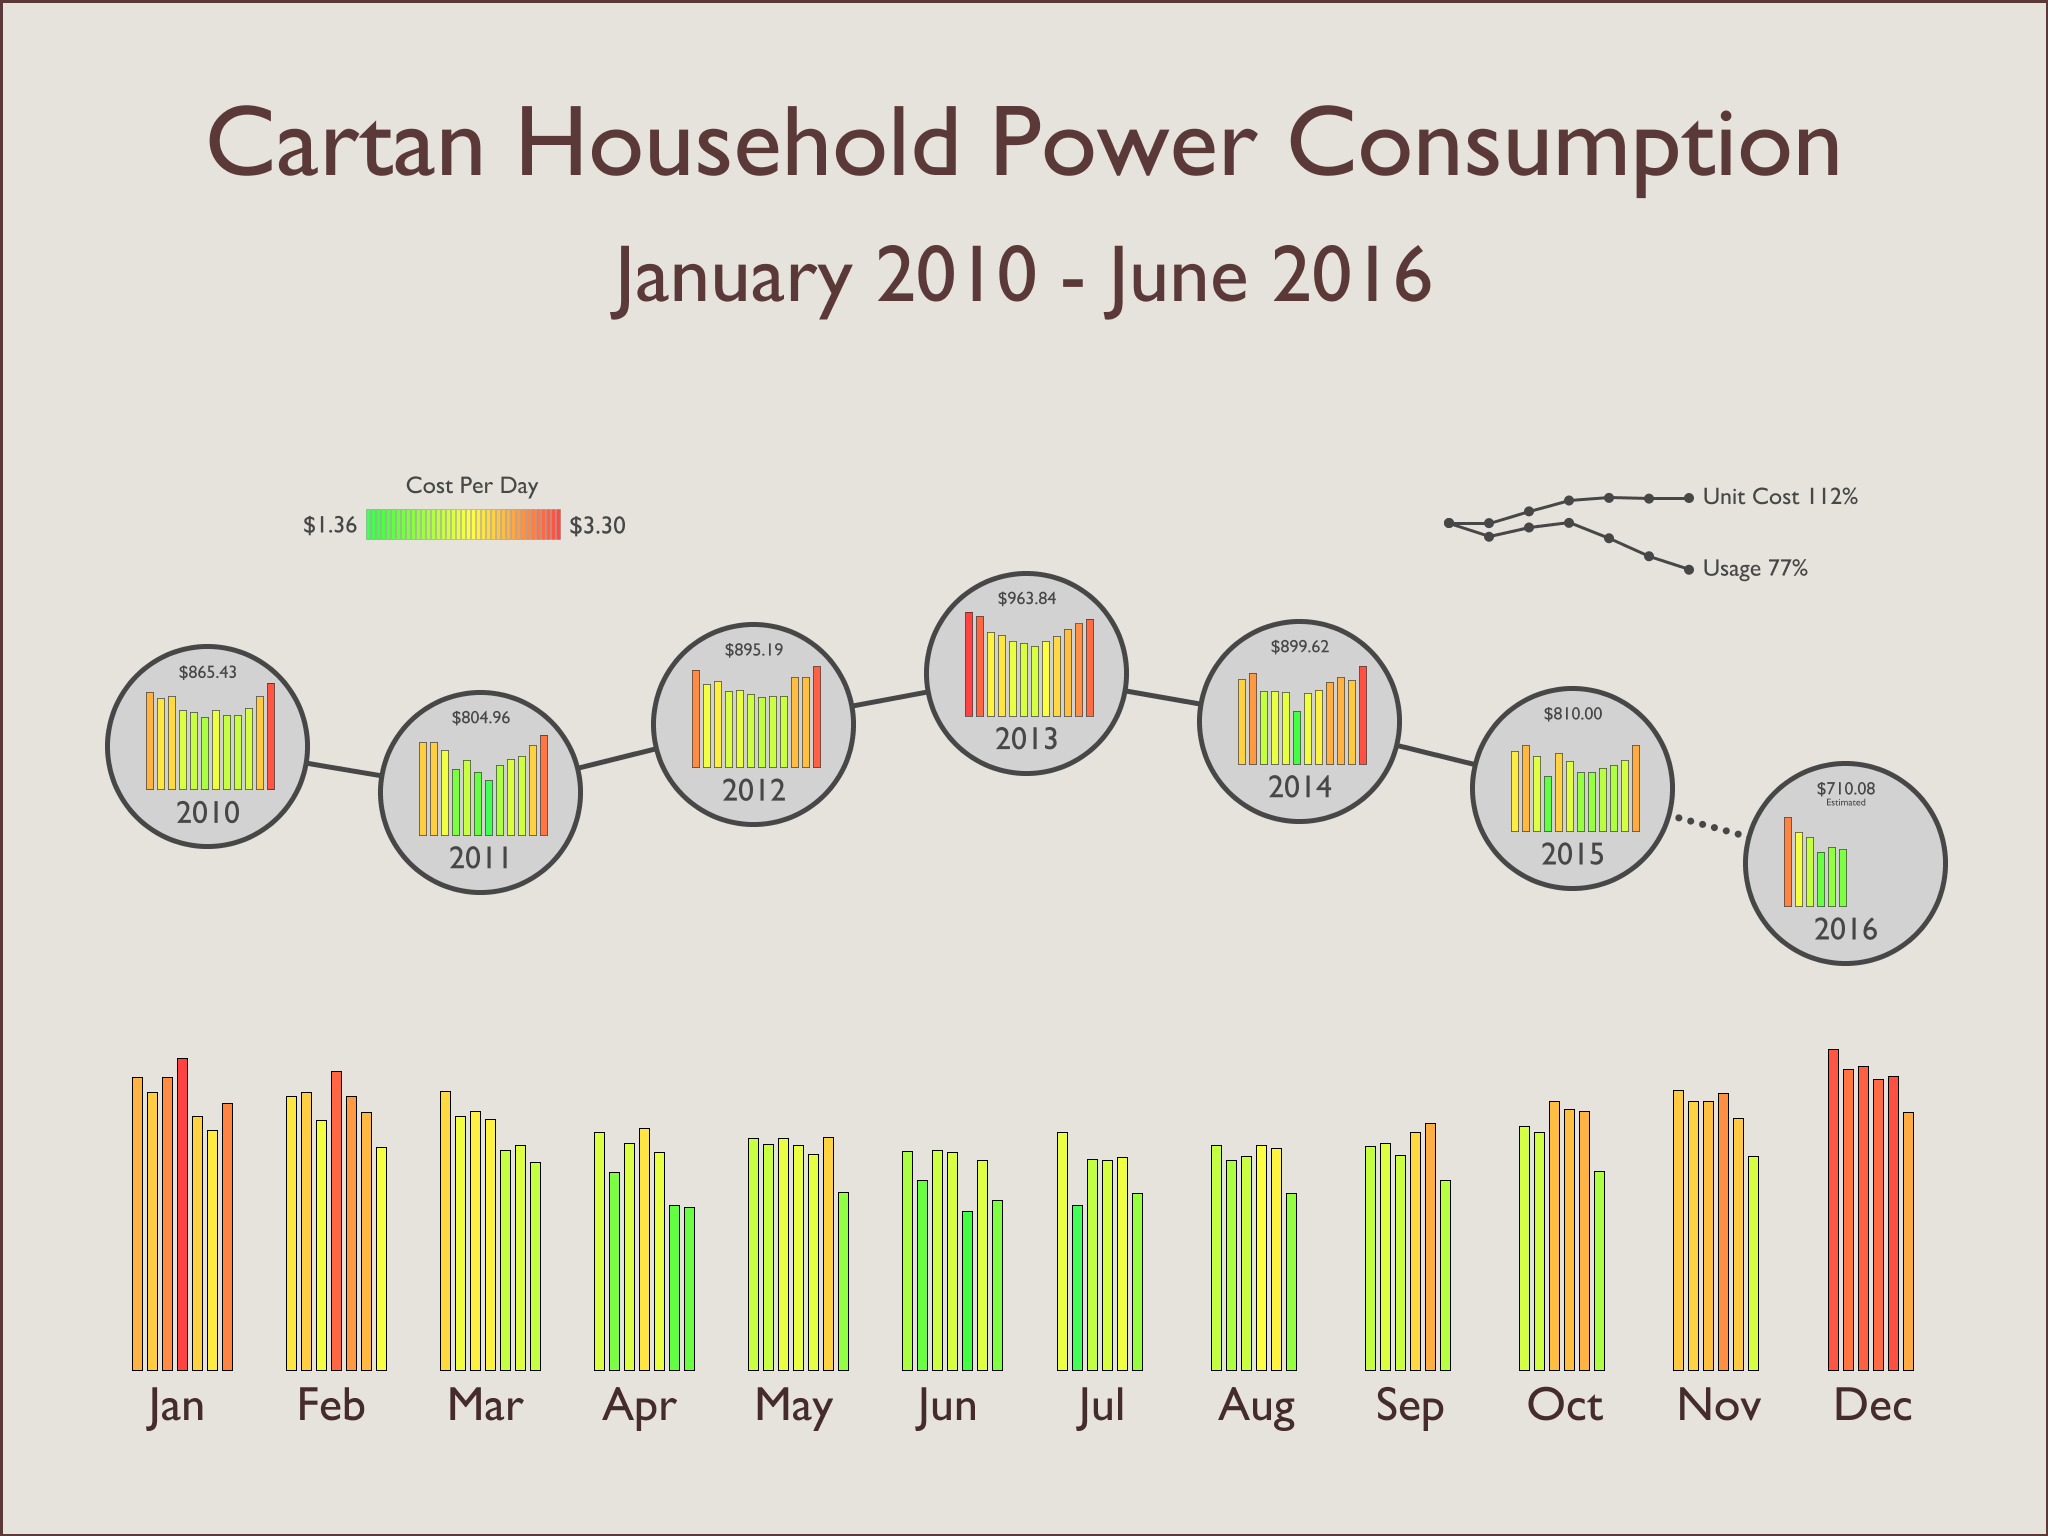
My goal with this weekend project was to chart six and a half years of monthly electric bills in a way that was both informative and elegant. My solution shows month-by-year and year-by-month usage, color coded by cost, with annual changes in overall usage and cost per unit as a reference.
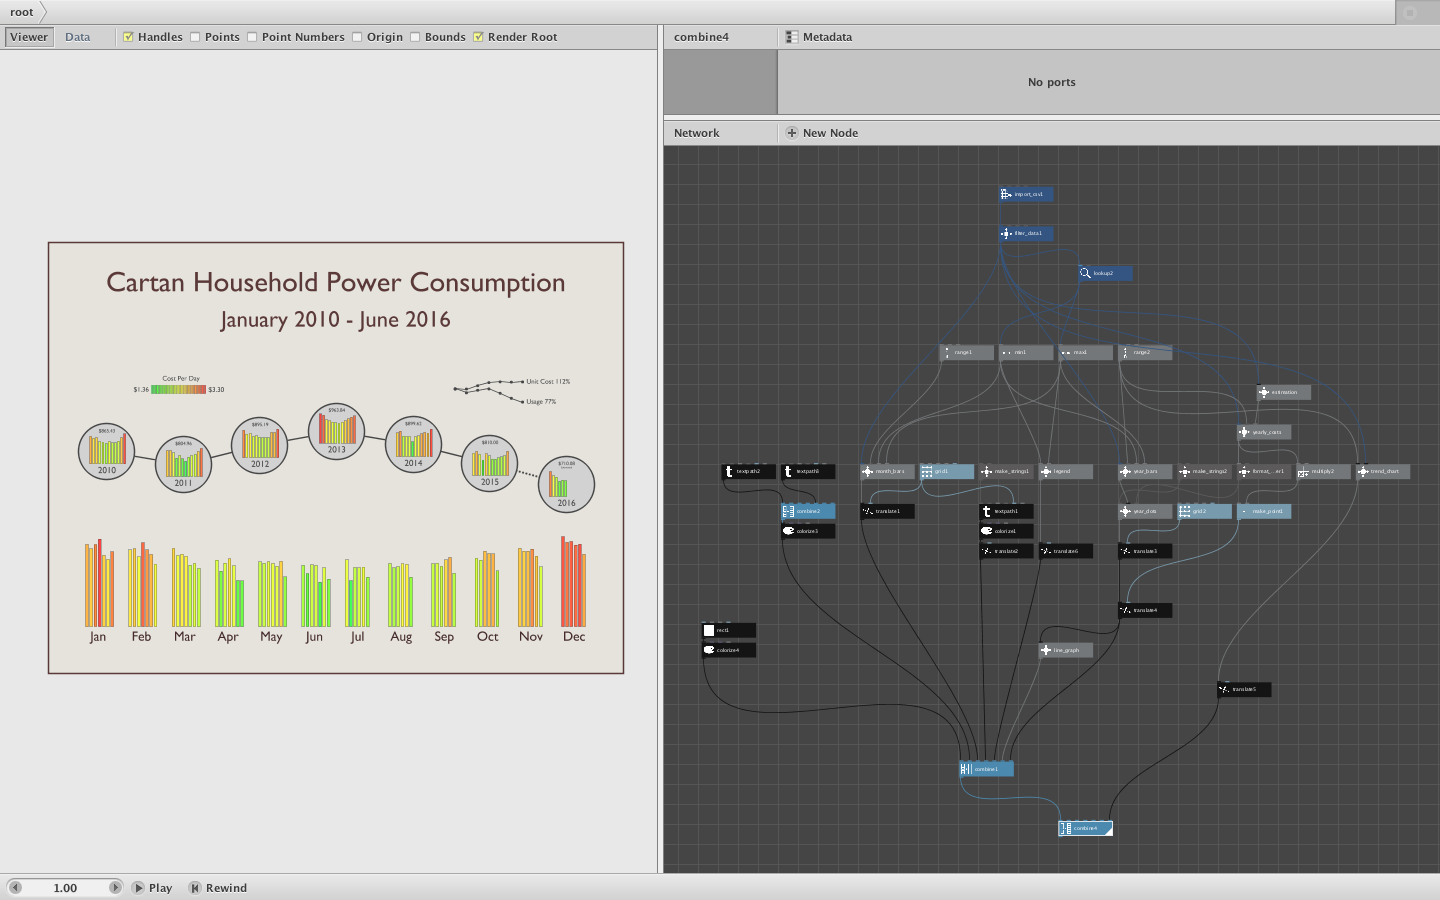
This is what I came up with. The zip file contains my nodebox network and the csv file dowloaded from my local power company website. Comments welcome.
Enjoy!
John