Hello!
I got know Nodebox last week during Frederik de Blesser's presentation at the Visualizing Knowledge seminar here in Helsinki.
It's not the easiest thing to get started with, but I felt like my experience with PureData somehow helped...
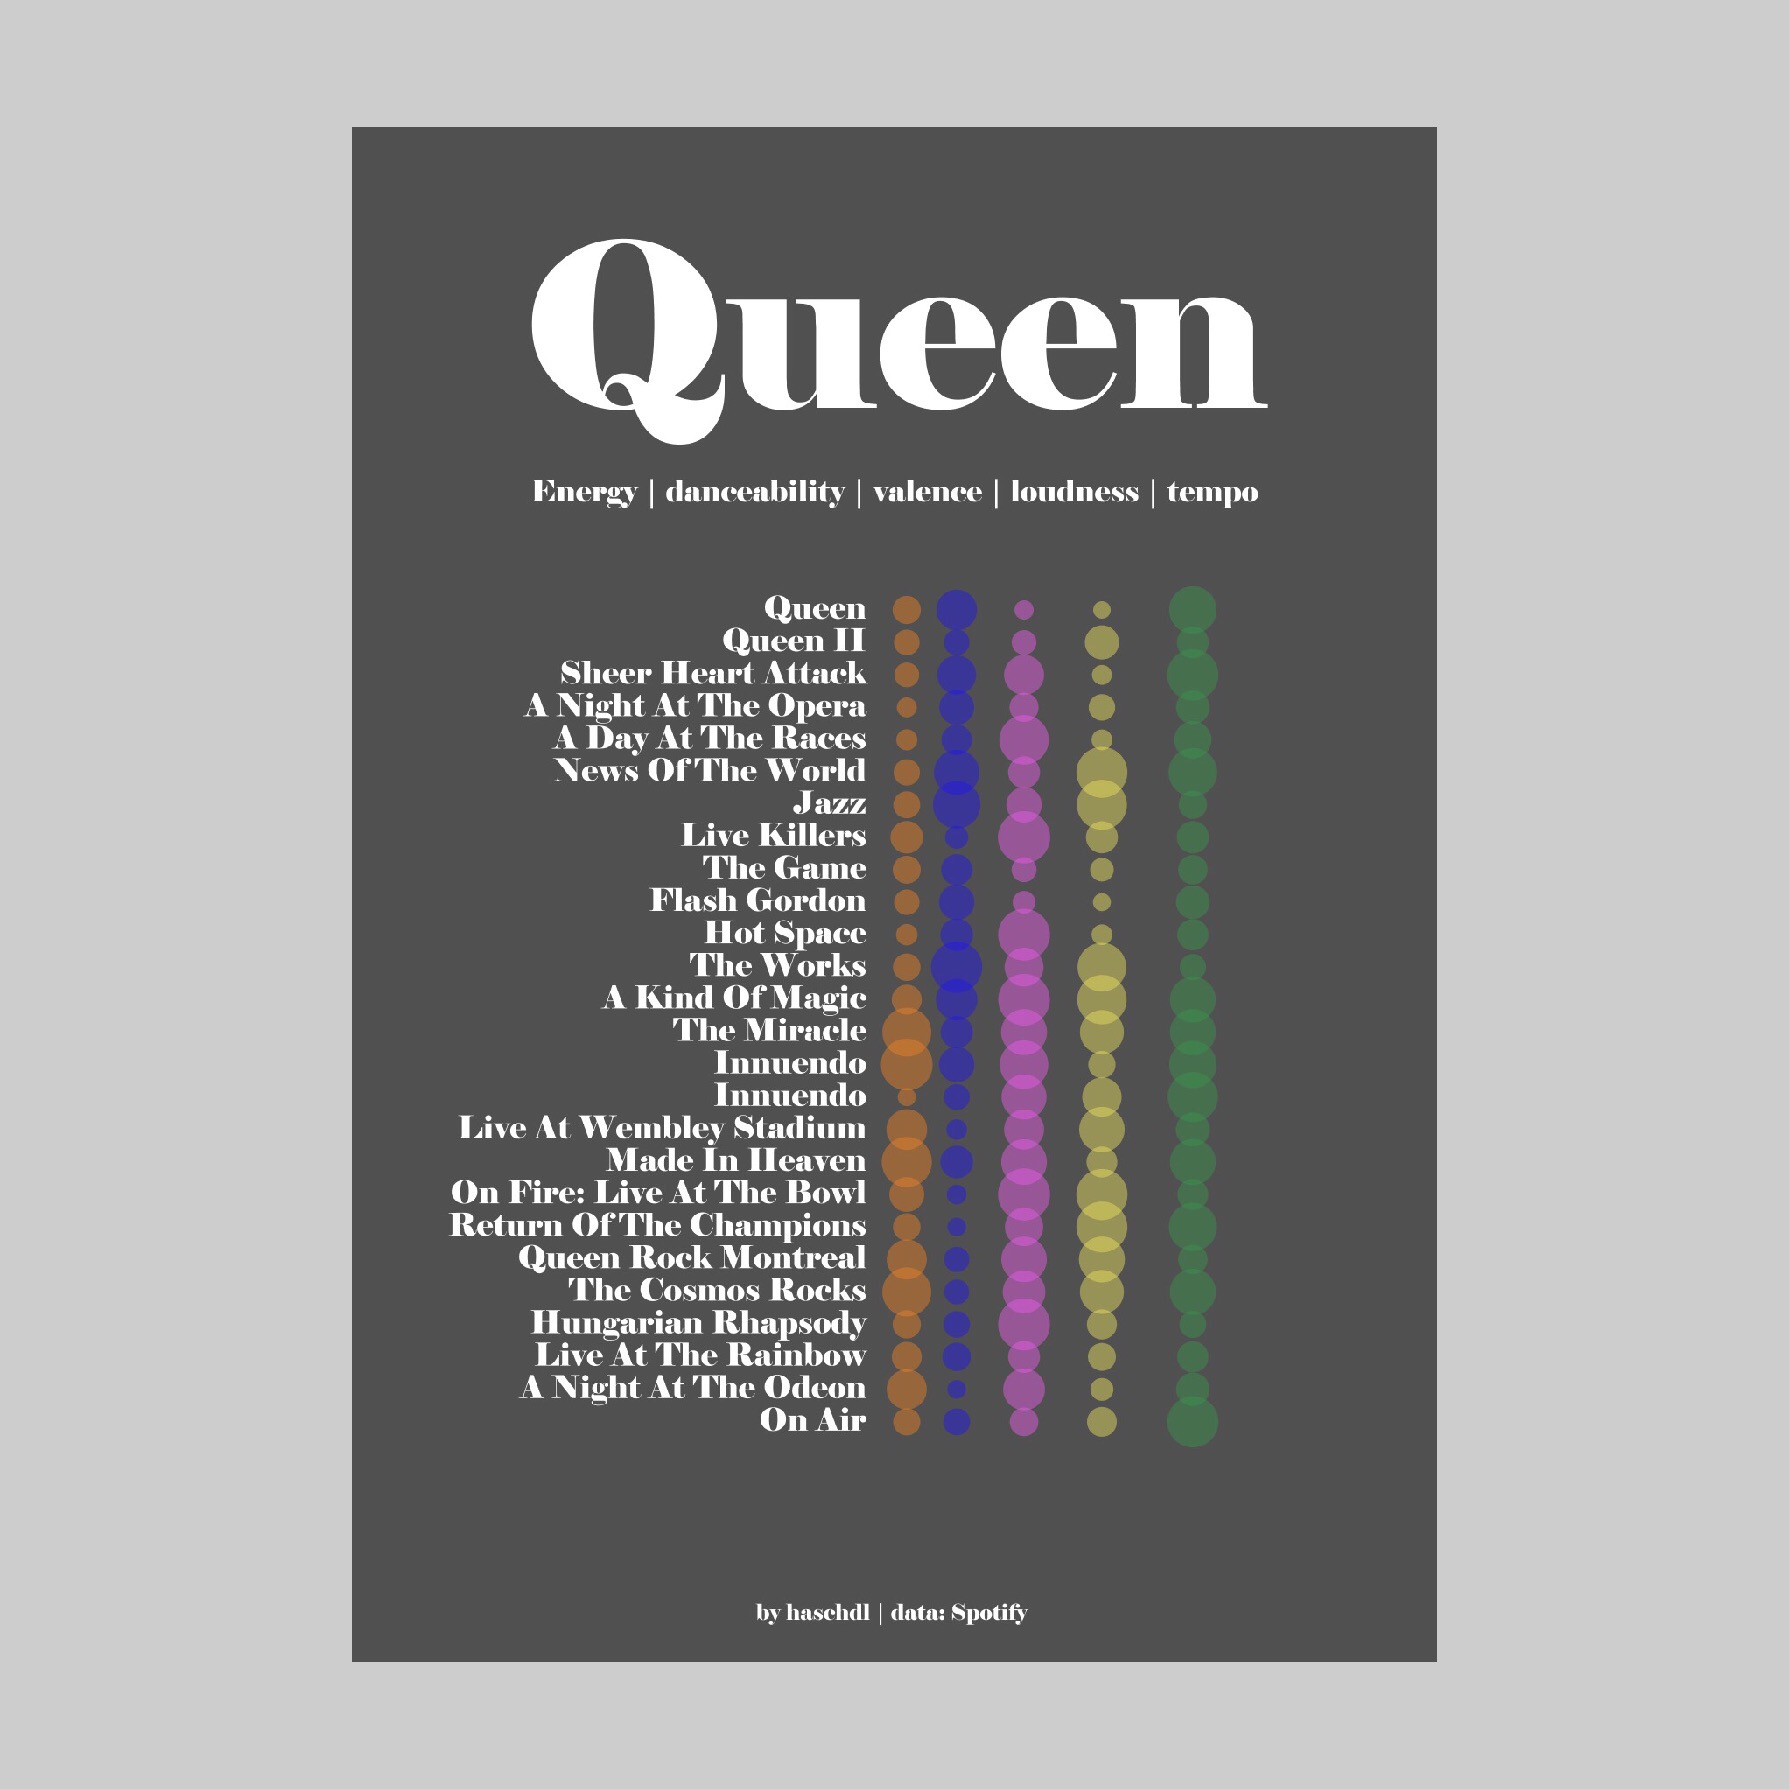
I created this chart based on data extracted from Spotify API. It shows an average of loudness, valence, danceability and energy for all Queen albums. Inspiration came also from a poster title My Music Moods - unfortunately I could verify who's the original author; Pinterest says uploaded by Amanda Rapien http://pin.it/D14zksZ
Let me know what you think.