Hi Jussi!
Welcome to the Nodebox community. It is exciting to meet someone who gets hooked and makes such immediate progress.
Counting data rows by year is not too hard in Nodebox, but does require one tricky concept: the subnetwork. Subnetworks allow you to define higher level functions by grouping nodes together. Crucially, they also allow you to control the way data is fed into your function, either one item at a time or all items at once.
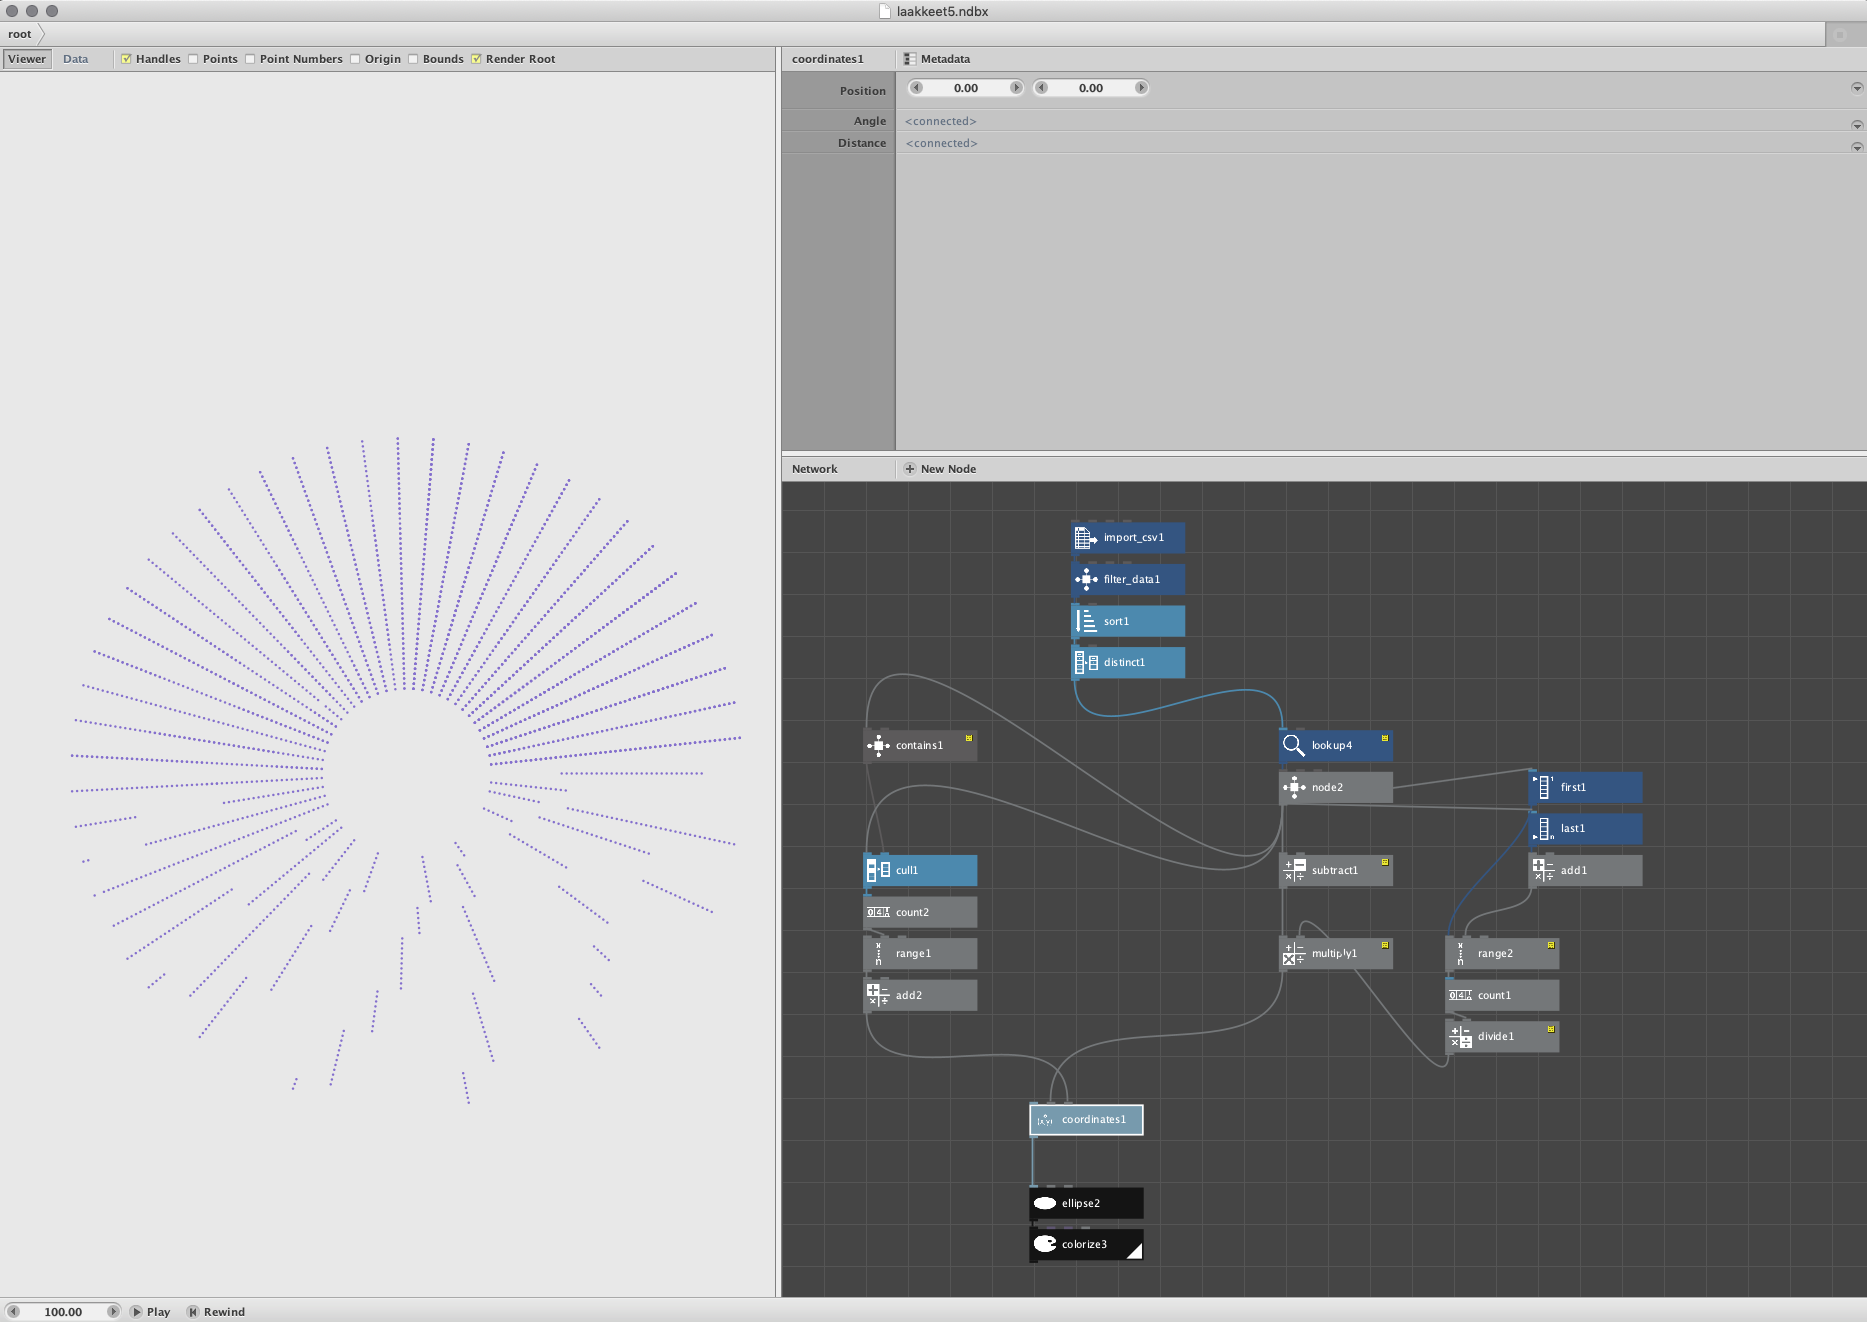
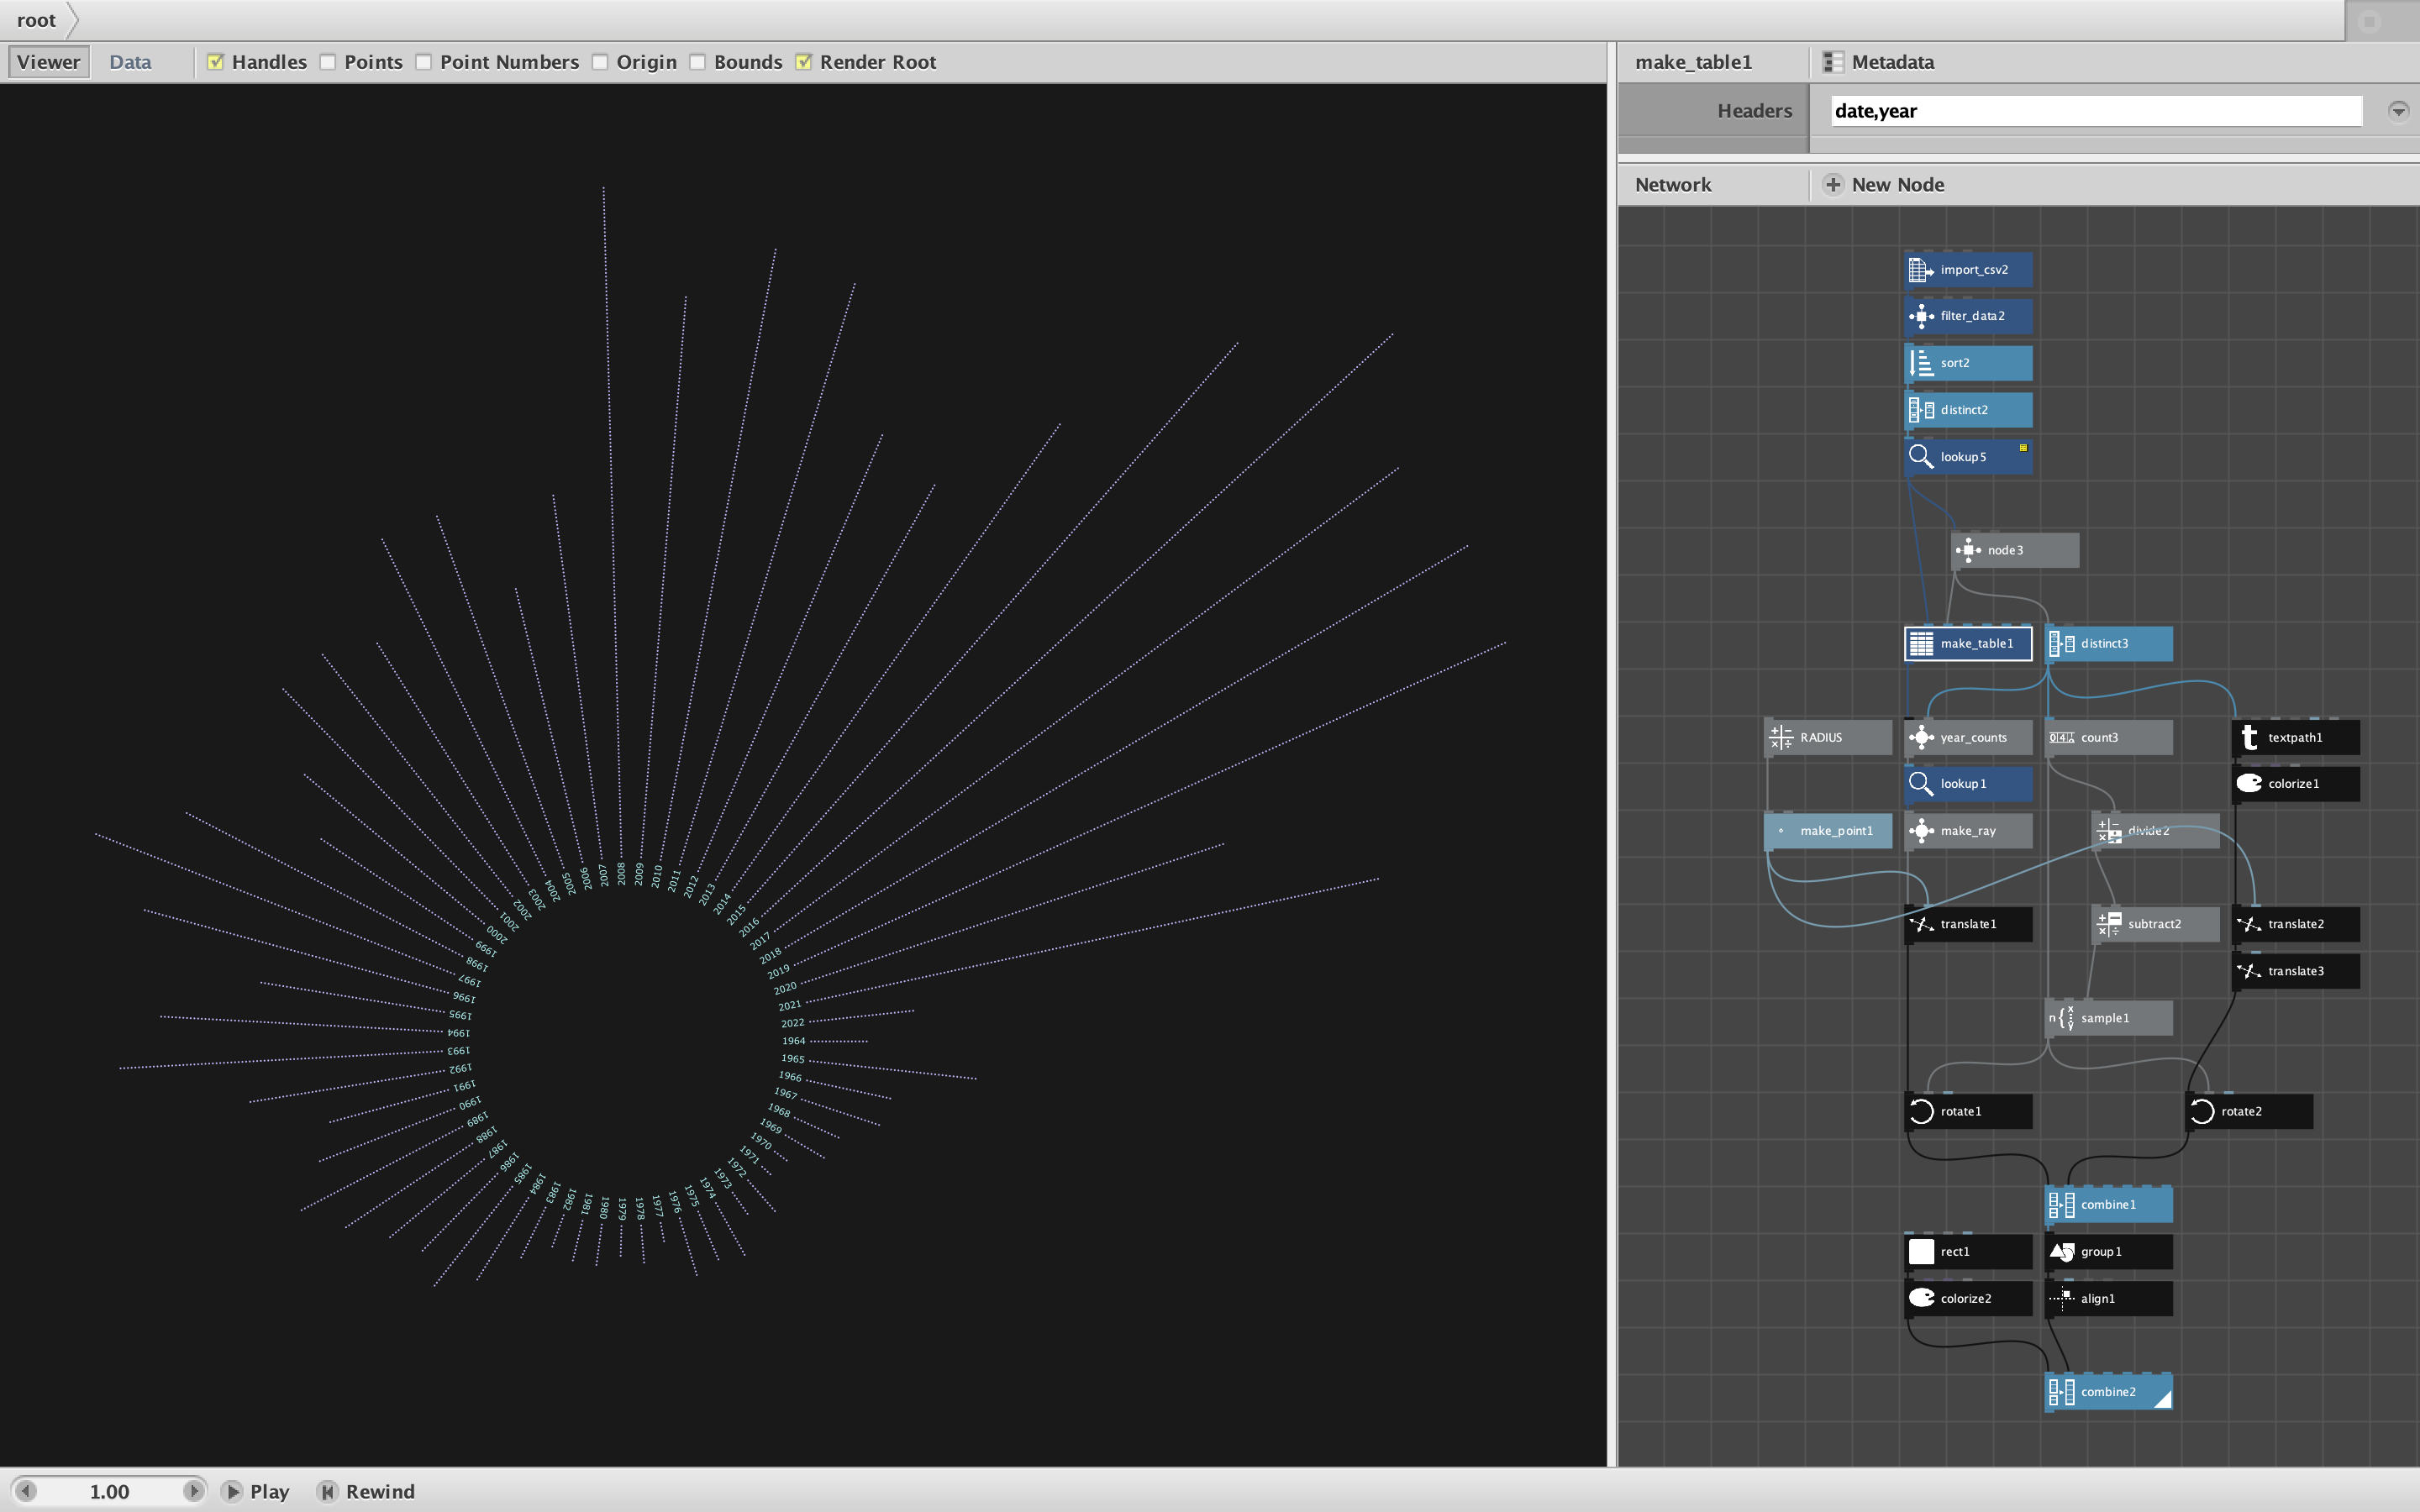
I made a demo to show you how this is done. See screenshot and attached zip file. My demo is called Year Counts.
The first problem we have is that your original data file does not have a year column (which we will need to do the counts). So I first make a simple table with only two columns: the date for each row (PAATOSPVM) and the clean year derived from your Clojure function.
I get a list of which years are in the data using a distinct node (there are 59 years from 1964 to 2022). I then feed that list of 59 years, plus the simple data table I just made, into a subnetwork called year_counts. Open it up (control-click "Edit Children") to see how it works.
All I do is filter the data table to a single year and then count the rows. I then return another simple table with year and count.
The reason I had to wrap this inside a subnetwork is that we need this function to fire once for each year, returning one row of the count table at a time. Each time the function fires we want to read in the entire data table, but only one year at a time.
To do this you have to do something that is not at all obvious and is not well documented. Once you make your subnetwork and publish the data (just a null node renamed as "data") and the year, you need to select it and open the Metadata dialog (just above the parameter pane). You will see two ports, data and year. Select data and change the Range value on the left from "Value" (one at a time) to "List" (all at once). Verify that the Range value for the year port remains as "Value"
Doing this ensures that each time the function fires the entire data file will be filtered against one year at a time. This is the least intuitive part of Nodebox and no one gets it without help. Fortunately, the rest of Nodebox is much more straightforward.
Once you have the counts for each year, the rest is pretty easy. There are MANY ways to make rays of dots. I used another subnetwork to make a group of N dots in a horizontal line (where N is the count for each year). I displace these to the right by an arbitrary value (RADIUS) and then rotate them evenly around a circle.
Tiny dots like this are a bit hard to see, so I lightened the color and placed them against a dark background. I also added labels for the years. Play with the demo to see how it works.
I hope this gets you unstuck. Once you get used to subnetworks, you should quickly start to get the hang of Nodebox. Just think of each node as a javascript function with inputs and a single output. You will find that debugging is MUCH easier and the immediate feedback you get by adjusting parameters is great fun.
Good luck and please don't hesitate to write again with more questions. I enjoy answering then and everyone benefits.
John