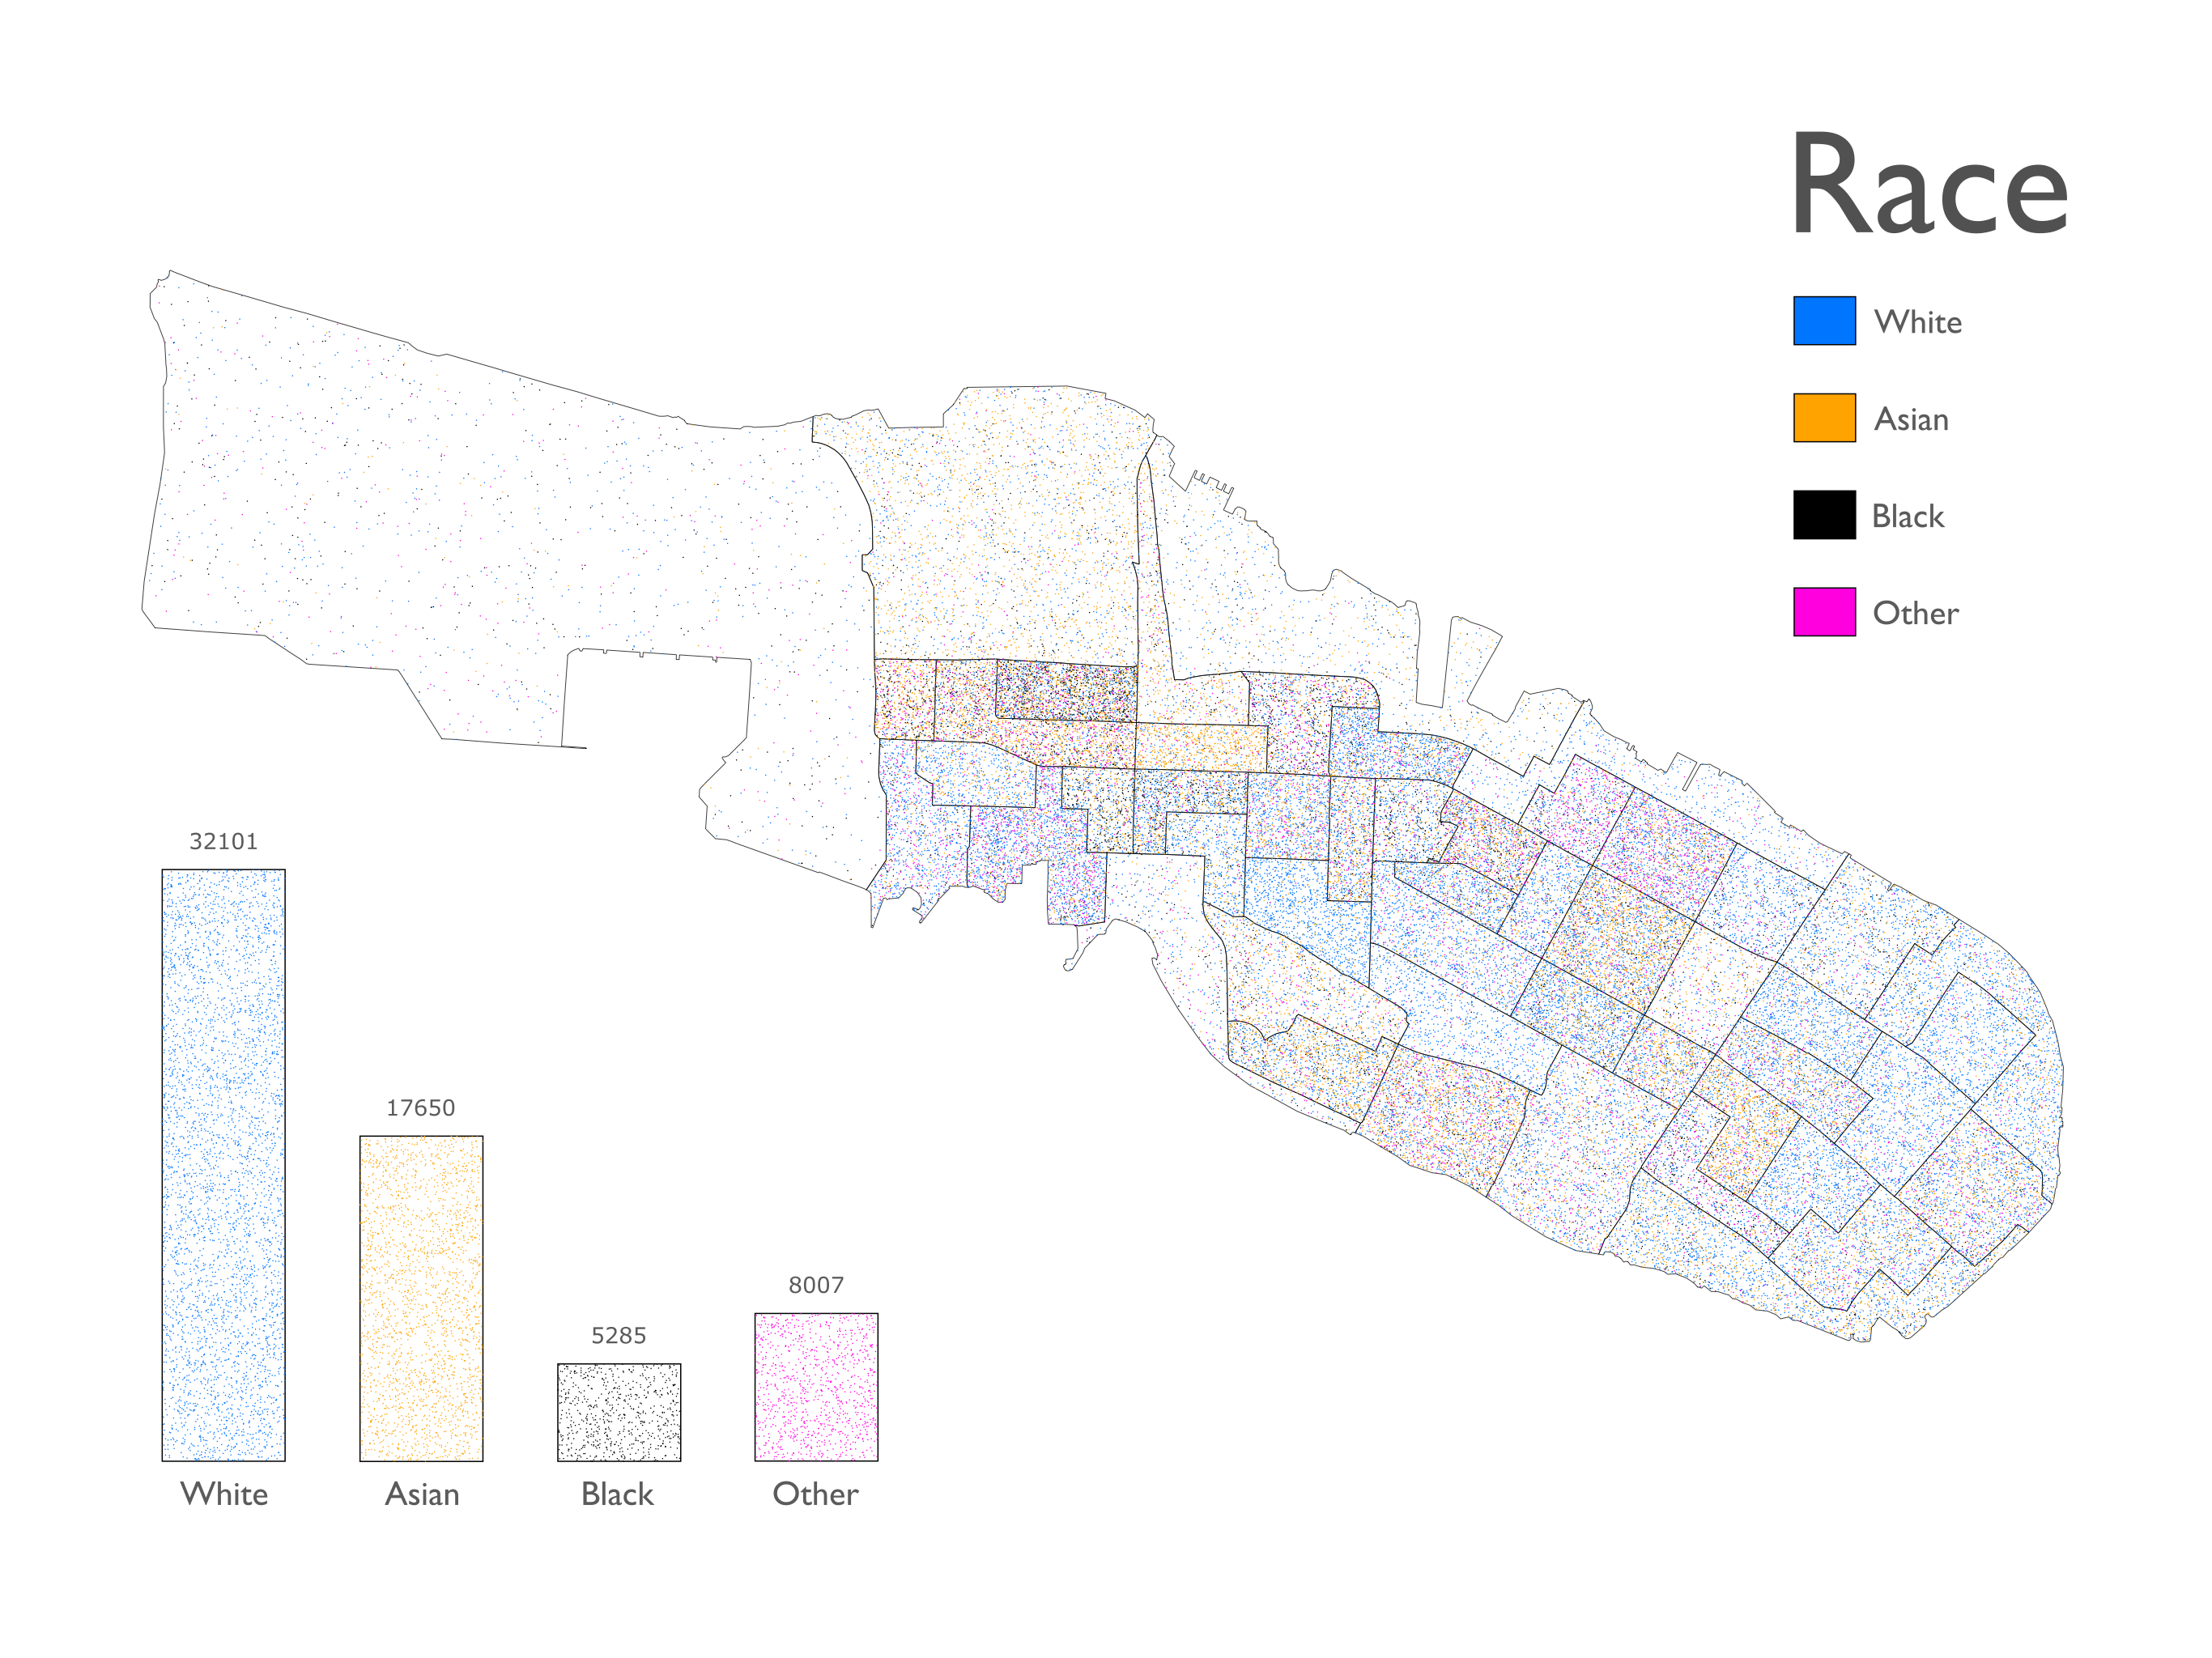
As an experiment in open source mapping, I created a number of choropleths (maps which use data to color or pattern areas) of my home island of Alameda. For one map I plotted self-identified race in Alameda using U.S. census data. Each colored dot represents one of the 63,043 people living on the main island. (Our diversity is one of the things I like about Alameda.)
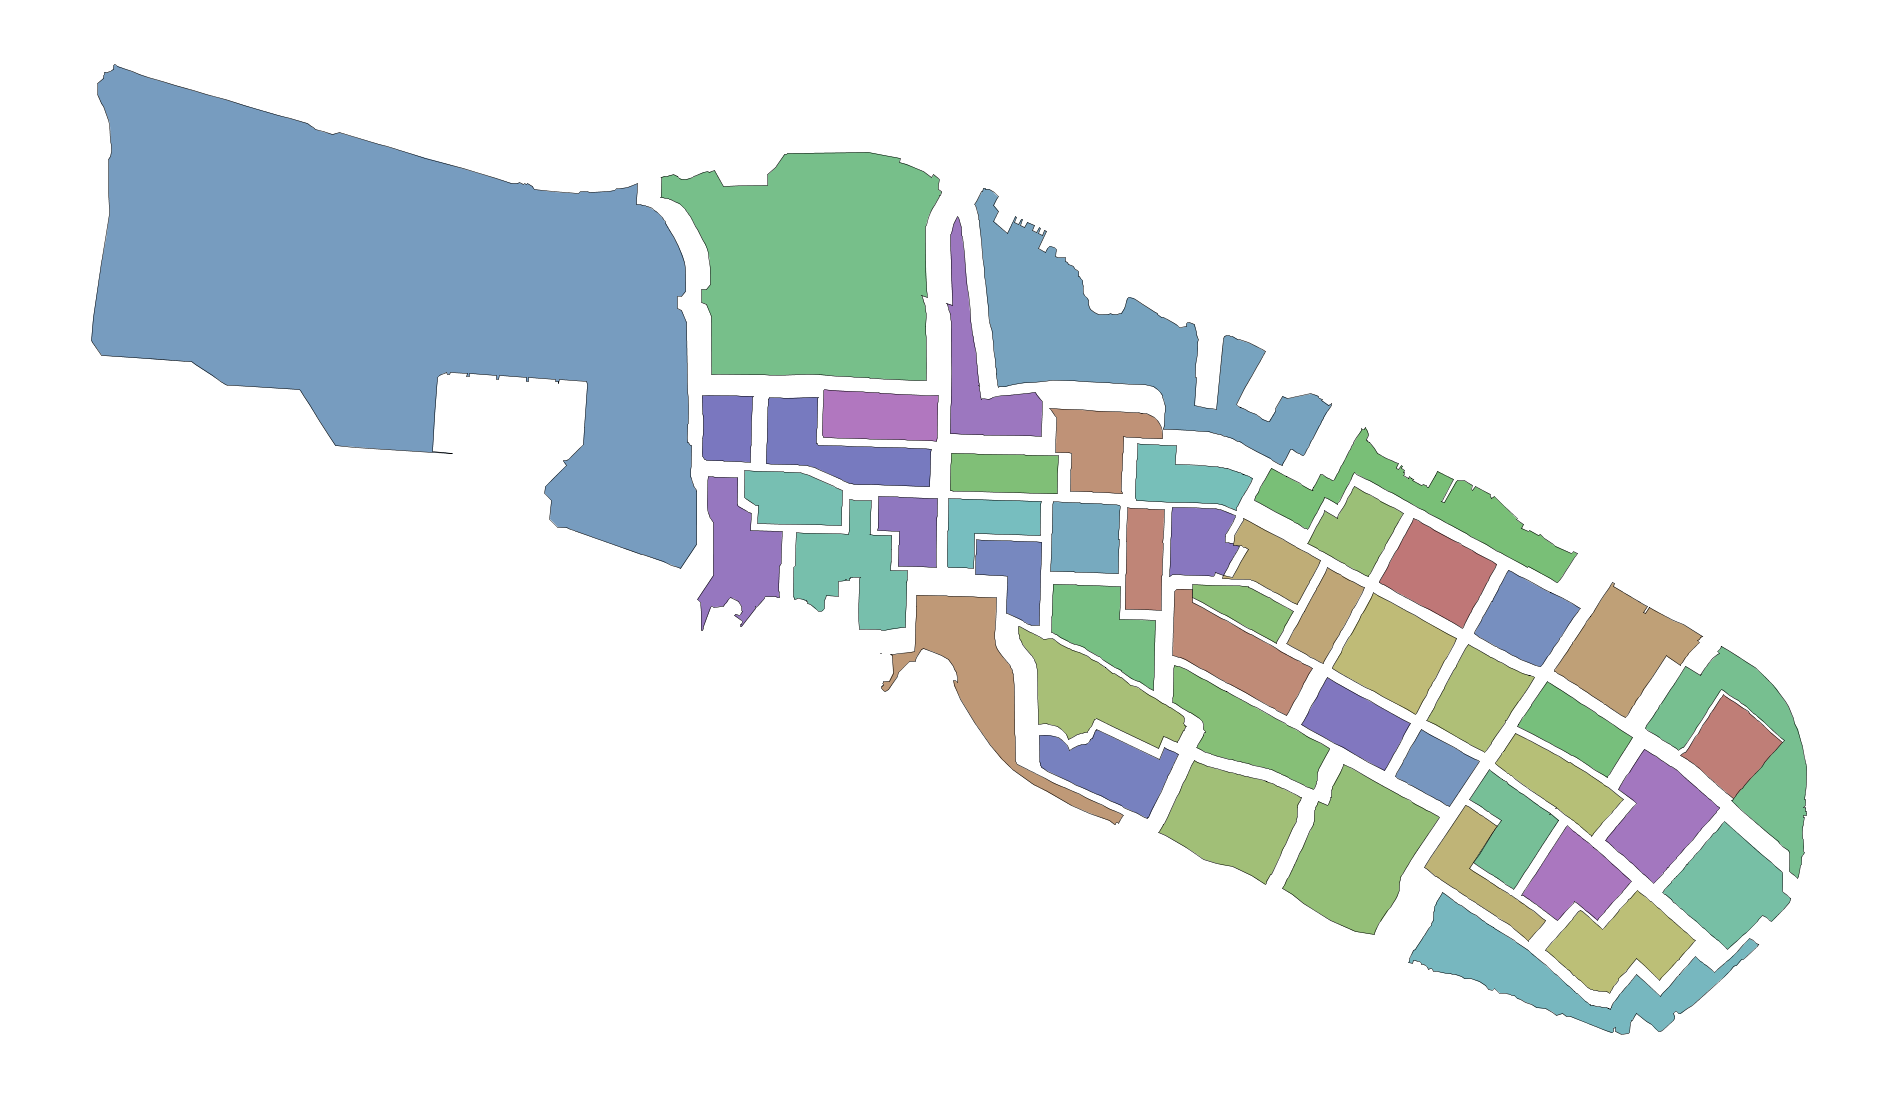
NodeBox was indispensable at every stage of the process, from parsing JSON files to drawing exploded block group boundaries. For more information about how I did this, see my blog post on AppsLab: http://theappslab.com/2017/09/27/choropleths/
Comments and questions welcome!
John