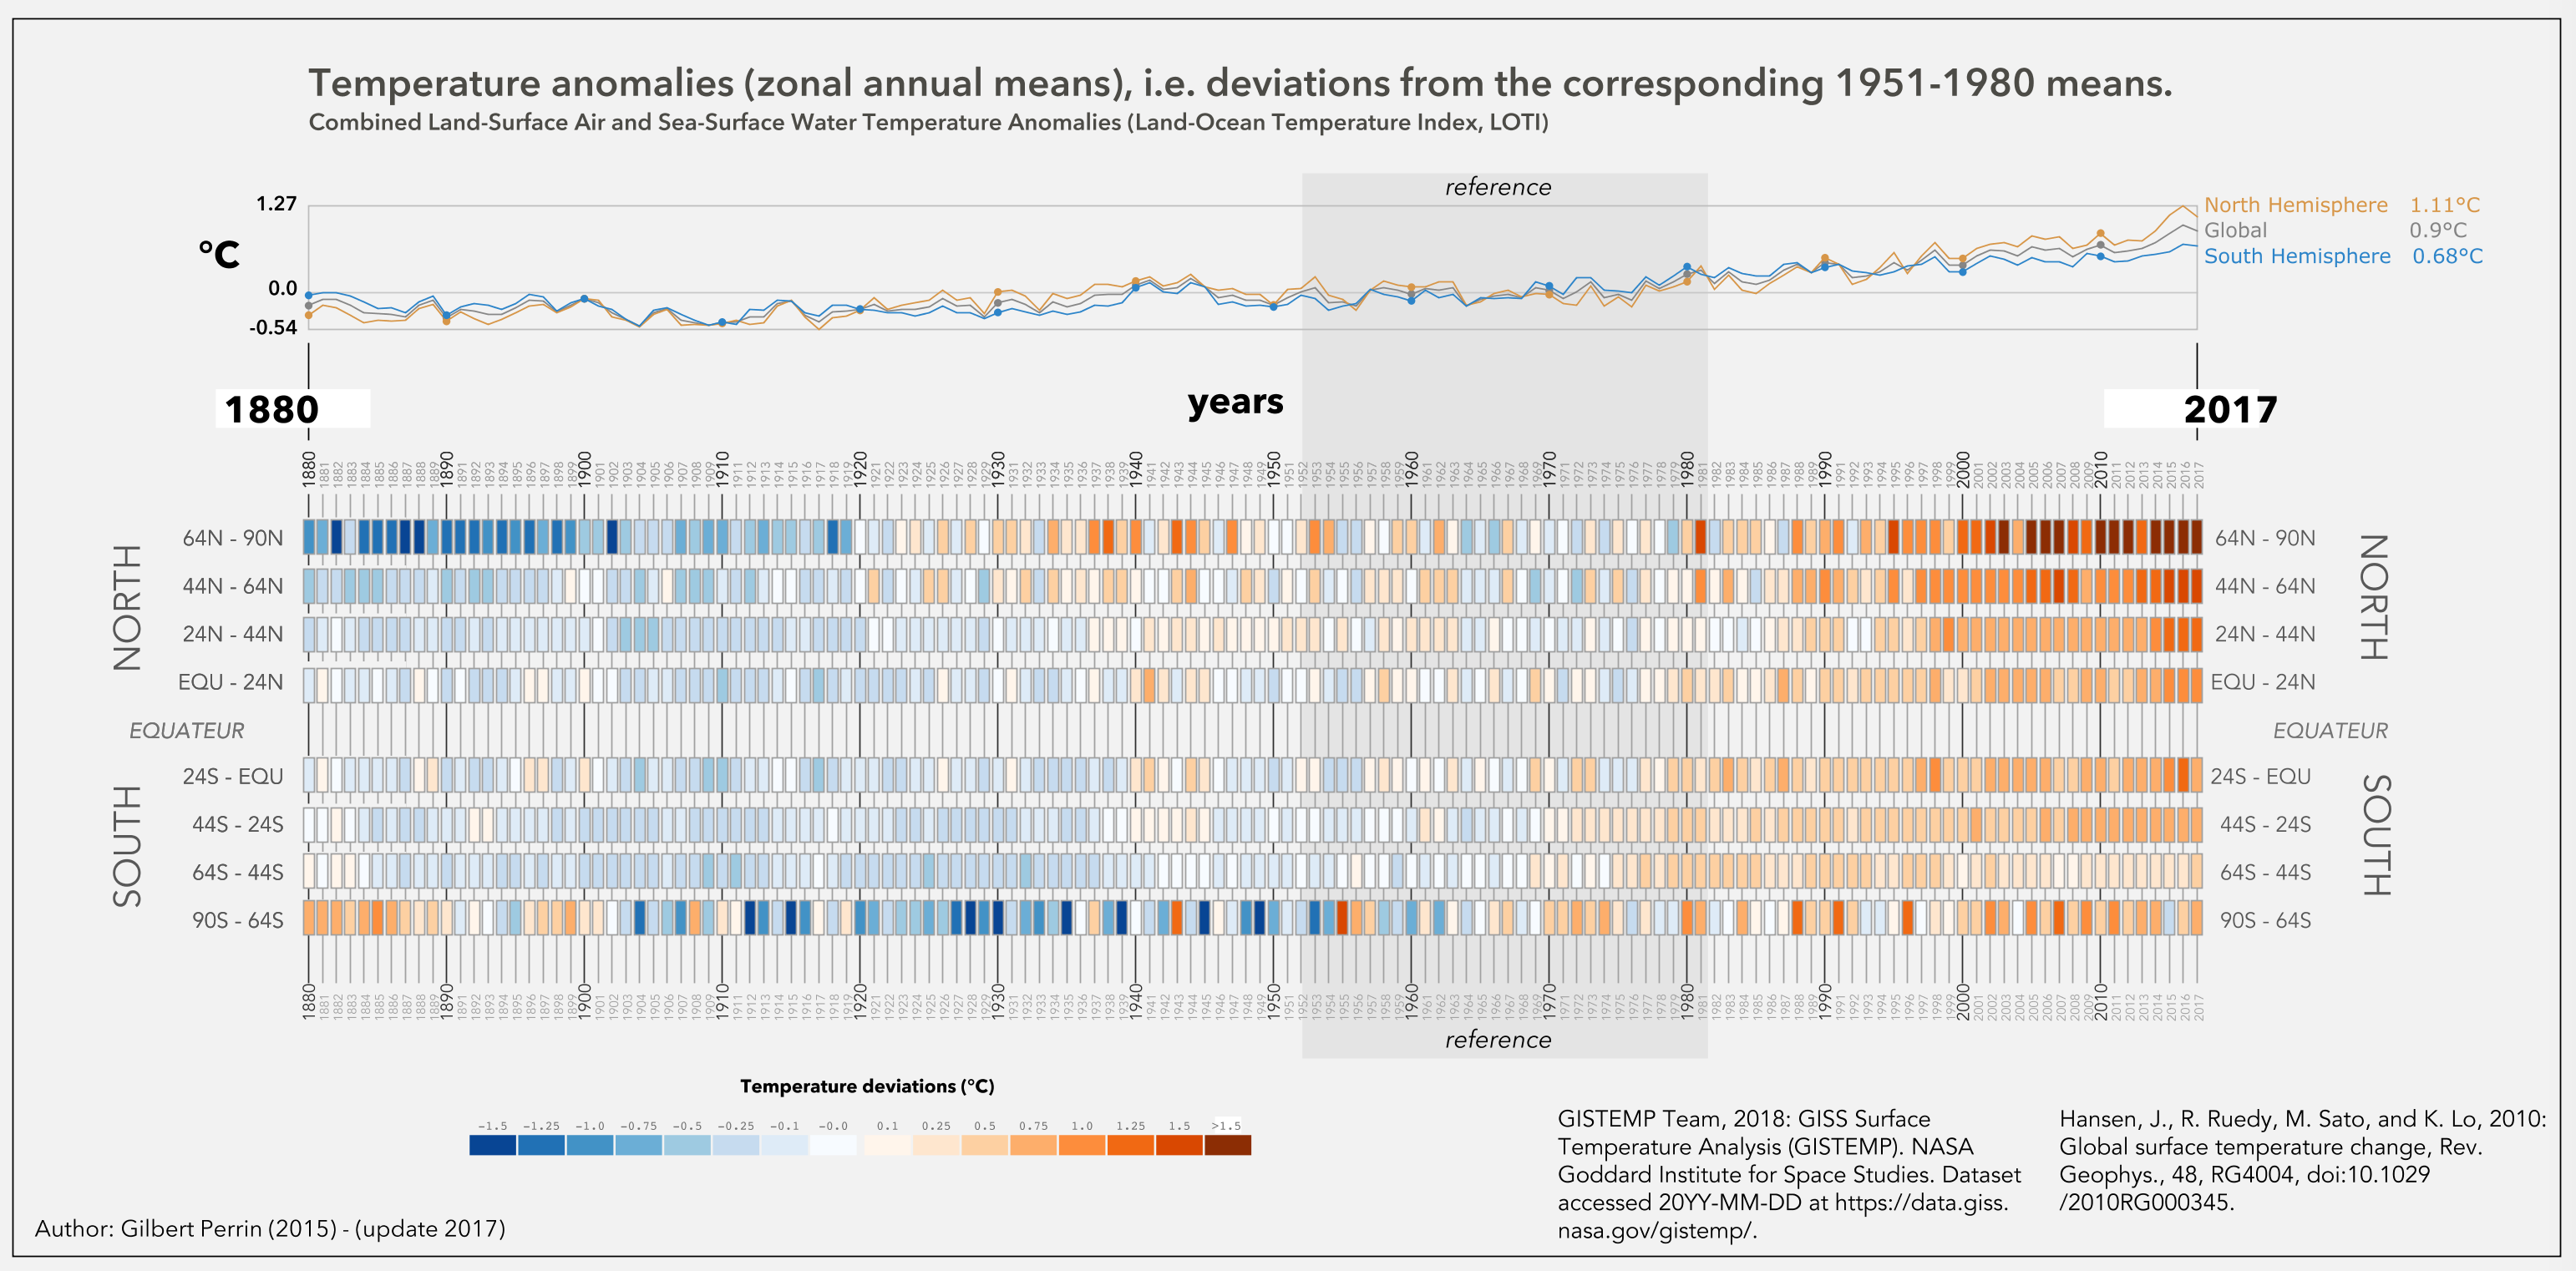
My own version of plotting global surface temperature changes based on NASA GISS data - Surface Temperature Analysis (GISTEMP) https://data.giss.nasa.gov/gistemp/
I have used Nodebox 3.
Not really a PRO of Nodebox but I really like it!
Gilbert
The new NodeBox forum is live! Everything from support.nodebox.net moved here: sign in with the same email to pick up your old posts. Something not working? Write to forum-support@nodebox.net.
Show your WorkFrom the old forum
My own version of plotting global surface temperature changes based on NASA GISS data - Surface Temperature Analysis (GISTEMP) https://data.giss.nasa.gov/gistemp/
I have used Nodebox 3.
Not really a PRO of Nodebox but I really like it!
Gilbert
Gilbert,
Nicely done! Your layout is clear and well-organized. Nice color ramps. This is one of the most attractive, informative and persuasive global warming charts I've seen.
Thanks for sharing. I'd love to see more of your NodeBox work.
John