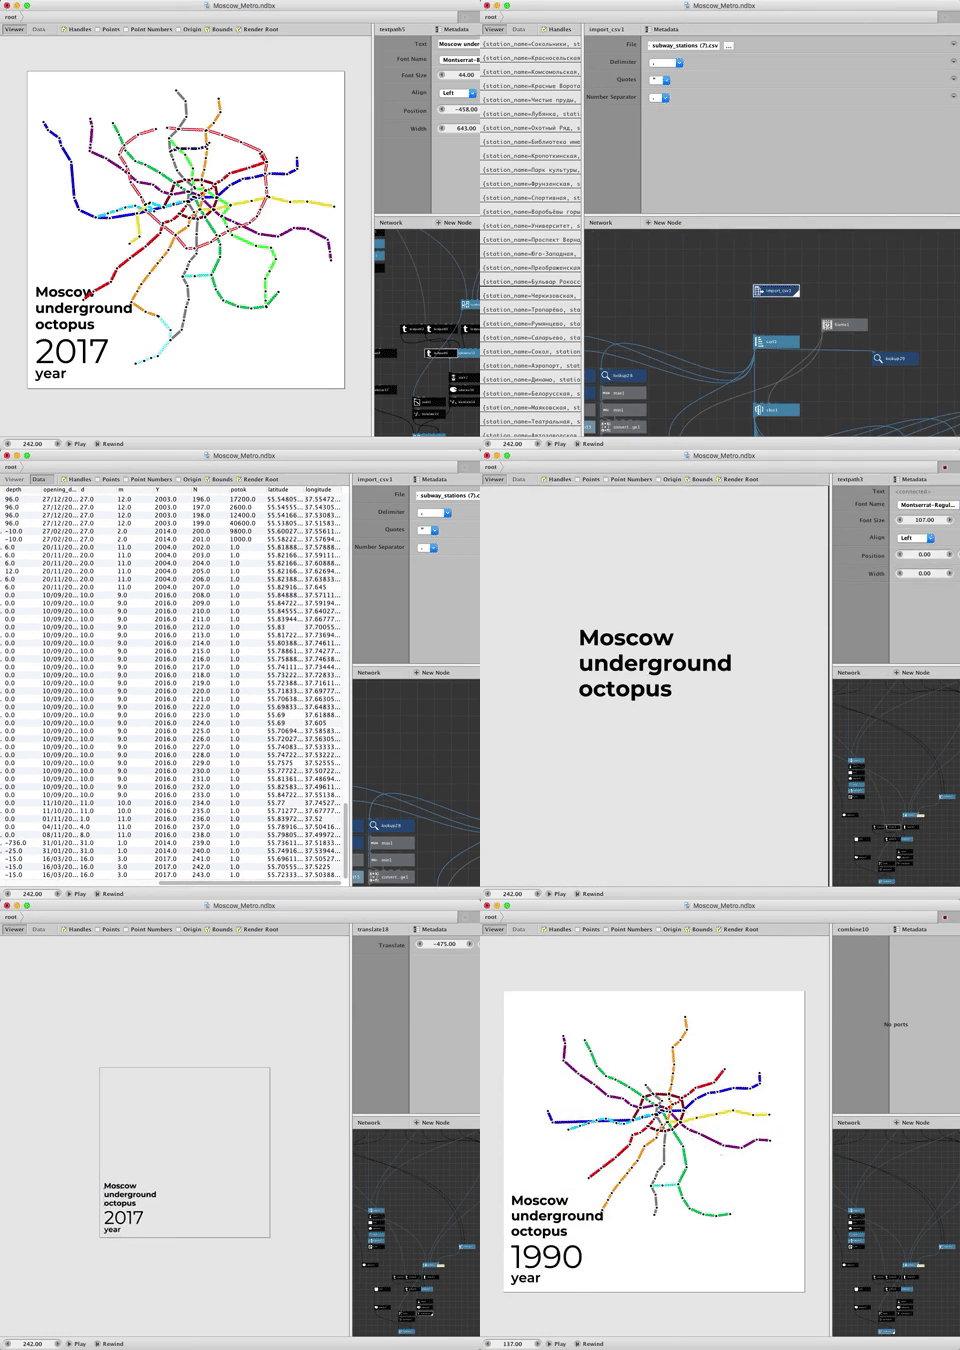
Simple and fast data visualization about the Moscow subway. Was made few monthes ago in Nodebox3 for one fun marathon-contest.
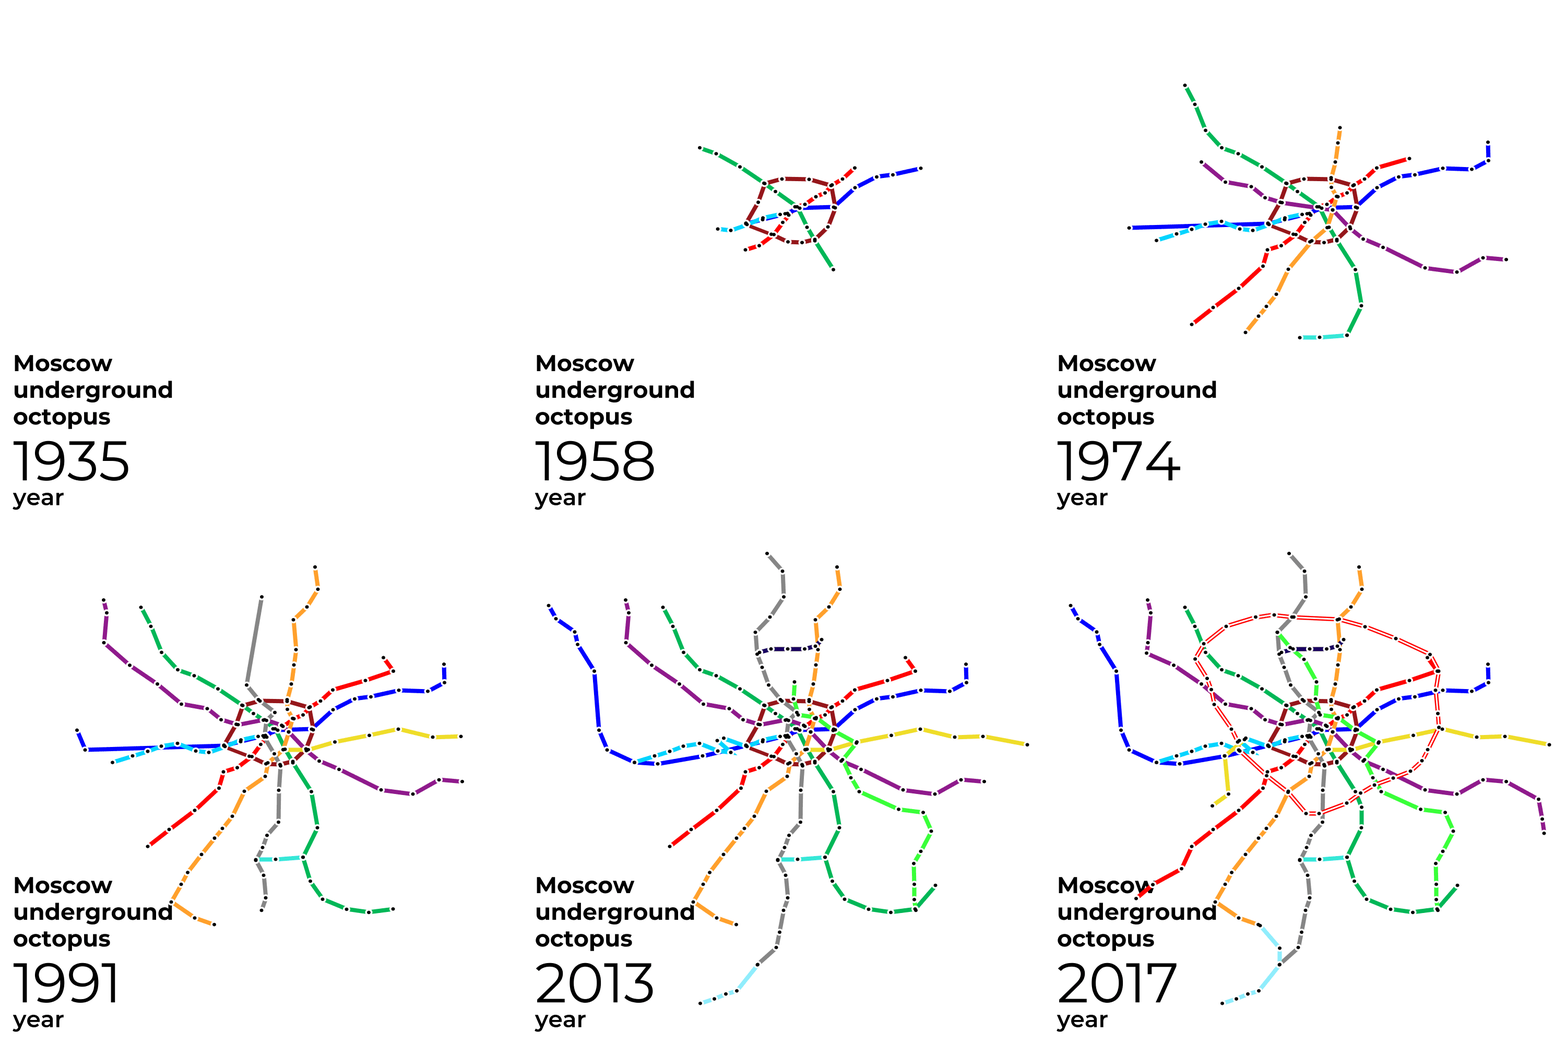
The list of stations with coordinates, opening date, line number and some additional information is automatically visualized by the algorithm. (There may be inaccuracies).
The csv file contains the coordinates of each station and the year the station was opened. The table is sorted by year and the points appear in chronological order and are connect by a line. The color of the line match to the color coding of the scheme of the Moscow subway.
in my Instagram
The new NodeBox forum is live! Everything from support.nodebox.net moved here: sign in with the same email to pick up your old posts. Something not working? Write to forum-support@nodebox.net.
Show your WorkFrom the old forum
Moscow subway
-
-
Awesome. Great work, how much time did you need?