With the NodeBox 3, can you really make a graph like the one that is at the top of the page? https://www.nodebox.net/node/documentation/using/data-visualization
Or you can only make the outside circle without connecting to the central points?
The new NodeBox forum is live! Everything from support.nodebox.net moved here: sign in with the same email to pick up your old posts. Something not working? Write to forum-support@nodebox.net.
NodeBox 3From the old forum
With the NodeBox 3, can you really make a graph like the one that is at the top of the page? https://www.nodebox.net/node/documentation/using/data-visualization
Or you can only make the outside circle without connecting to the central points?
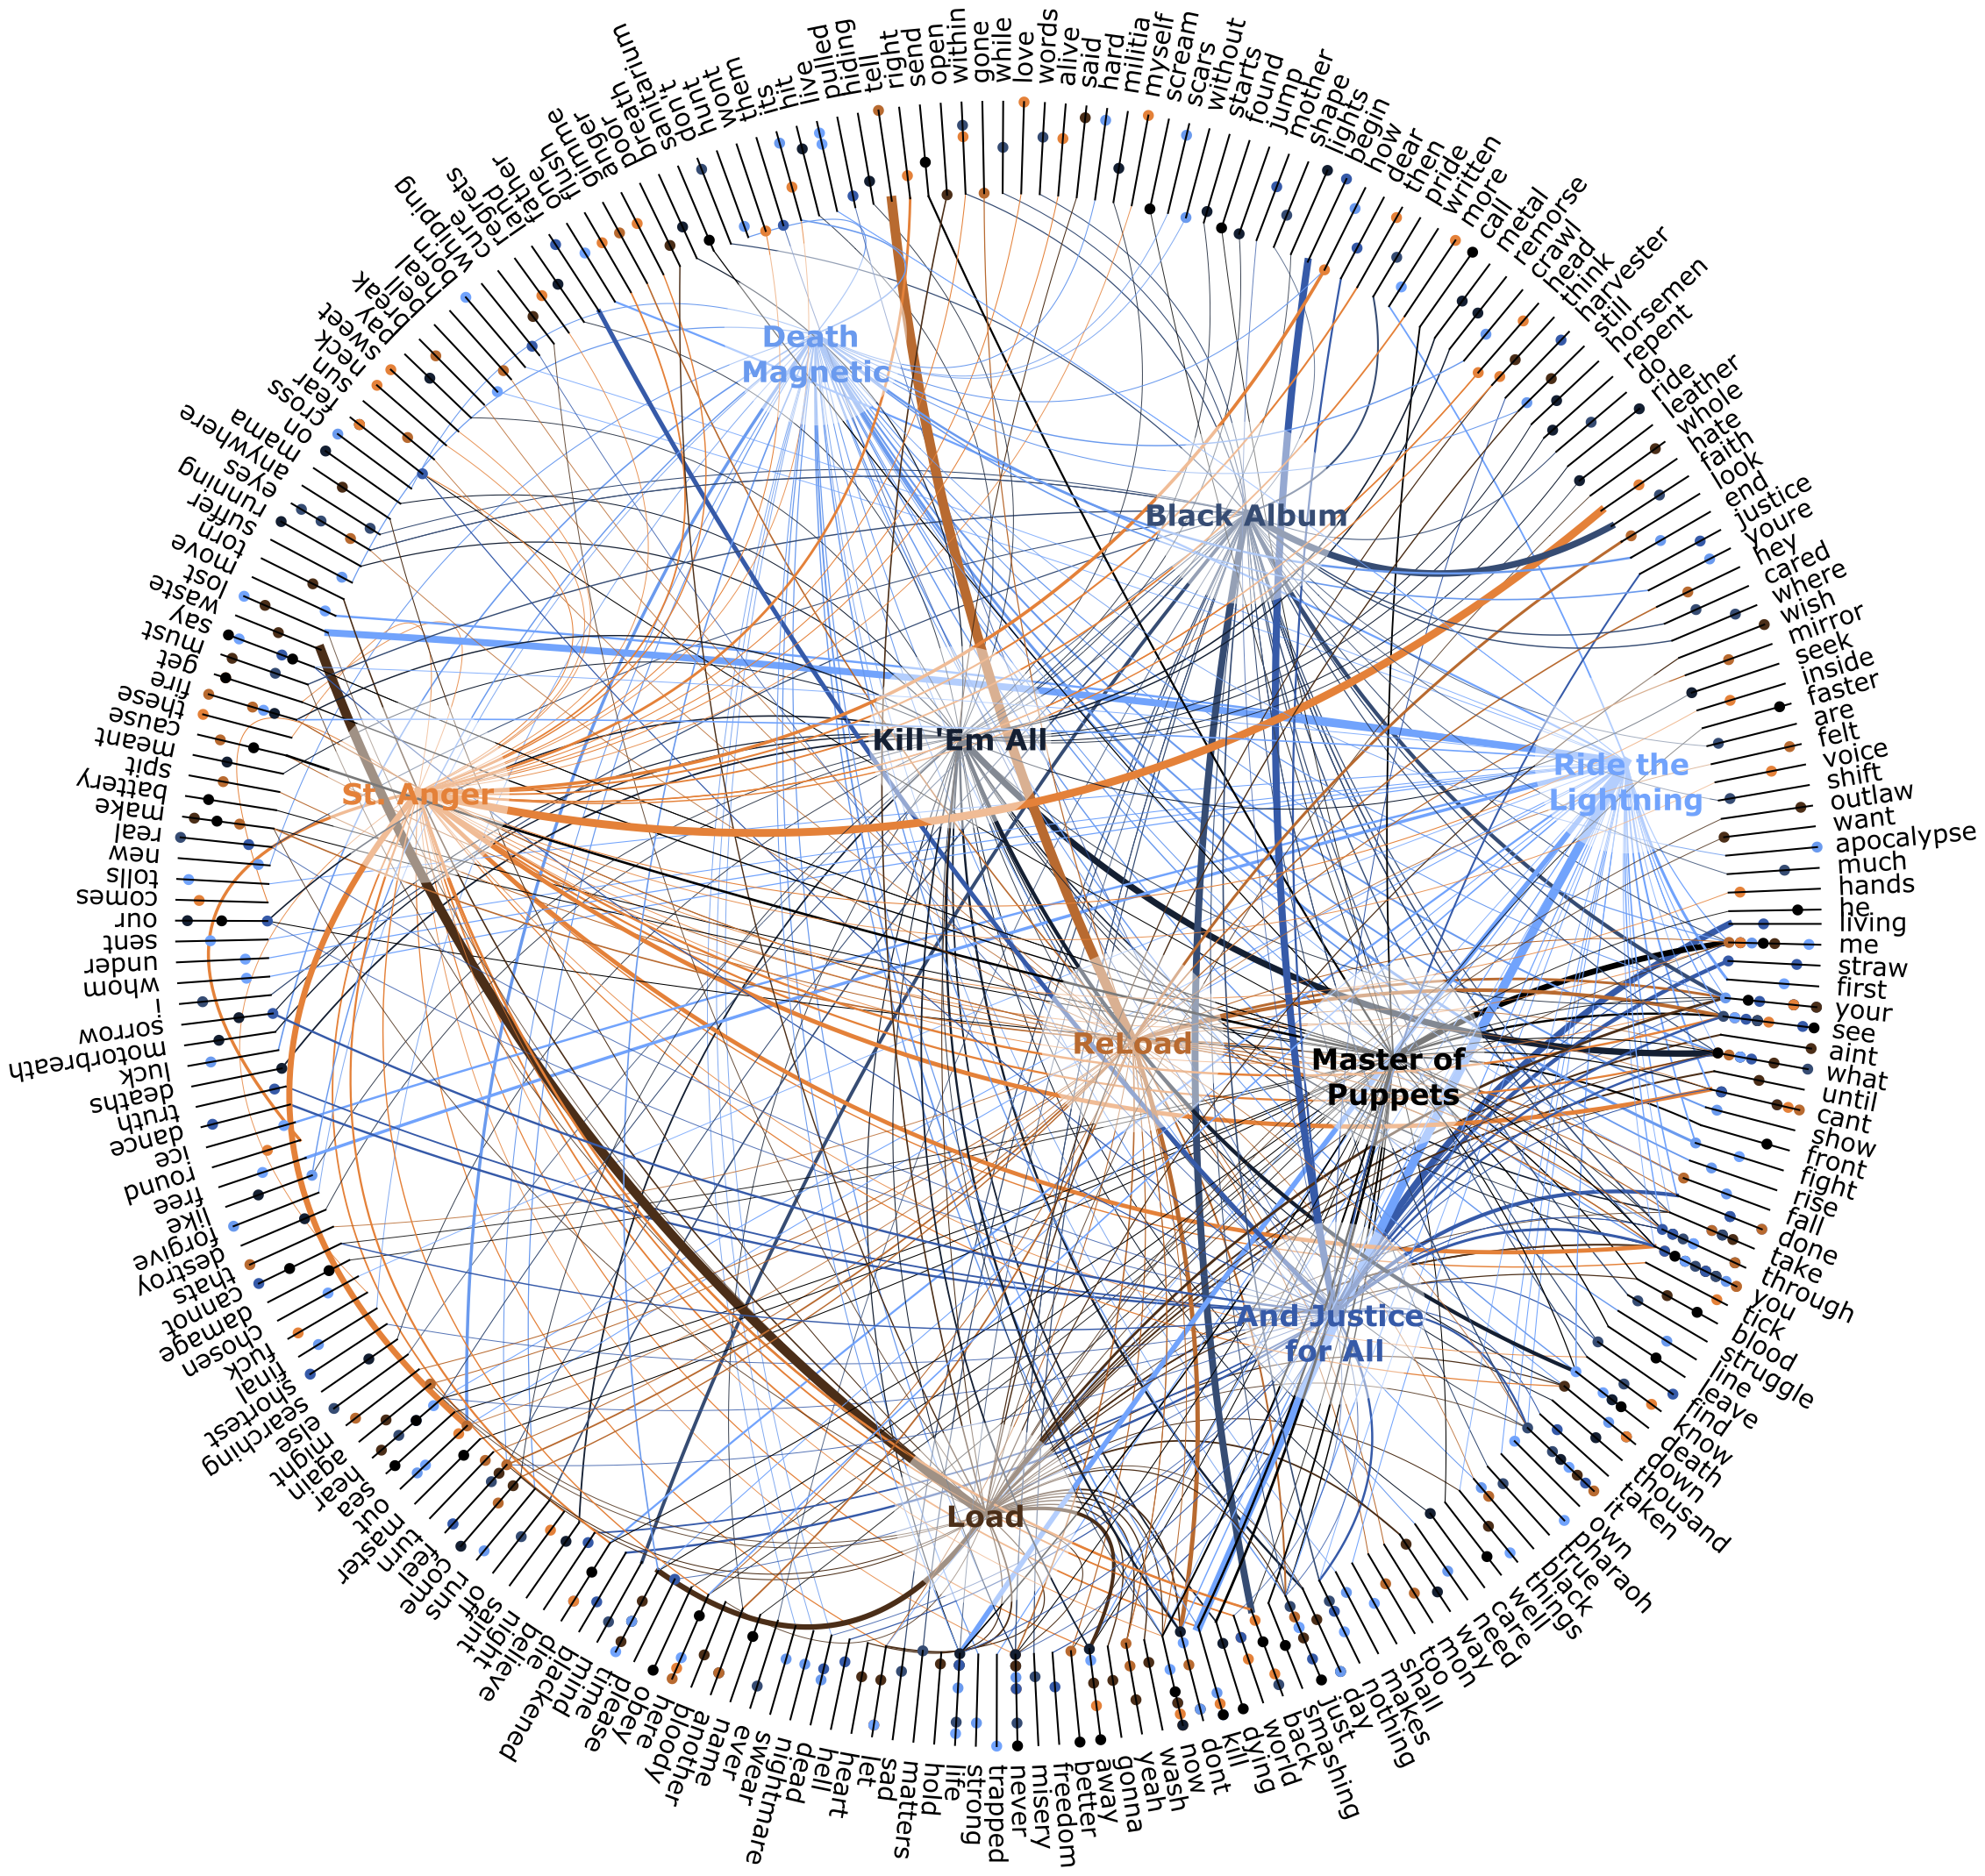
Sorry, my mistake, I was supposed to write at the bottom of the page, not at the top.
Bernardo,
You can absolutely make that graph in Nodebox. I'm sure that example was made in Nodebox.
There are at least four things going on in that chart that would be brought together in a combine node at the bottom of your network:
Each one of those four things is fairly easy to do in NodeBox. It looks like this was driven by the Metallica album CSV with each year mapped to an album title for the interior points. My guess is that the point positions were chosen at random using a scatter node.
Give it a try! If you get stuck post another note and I will get you unstuck.
John