Jussi,
Thanks for sharing this! I am delighted to hear that you are teaching data visualization.
In my mind the two major use cases for NodeBox are generative art and data visualization, and these two cases are deeply entangled. Nodebox is a spectacular tool for both. So it's fitting that an artist of your stature should "cross the line" and teach visualization. I hope your students realize how lucky they are.
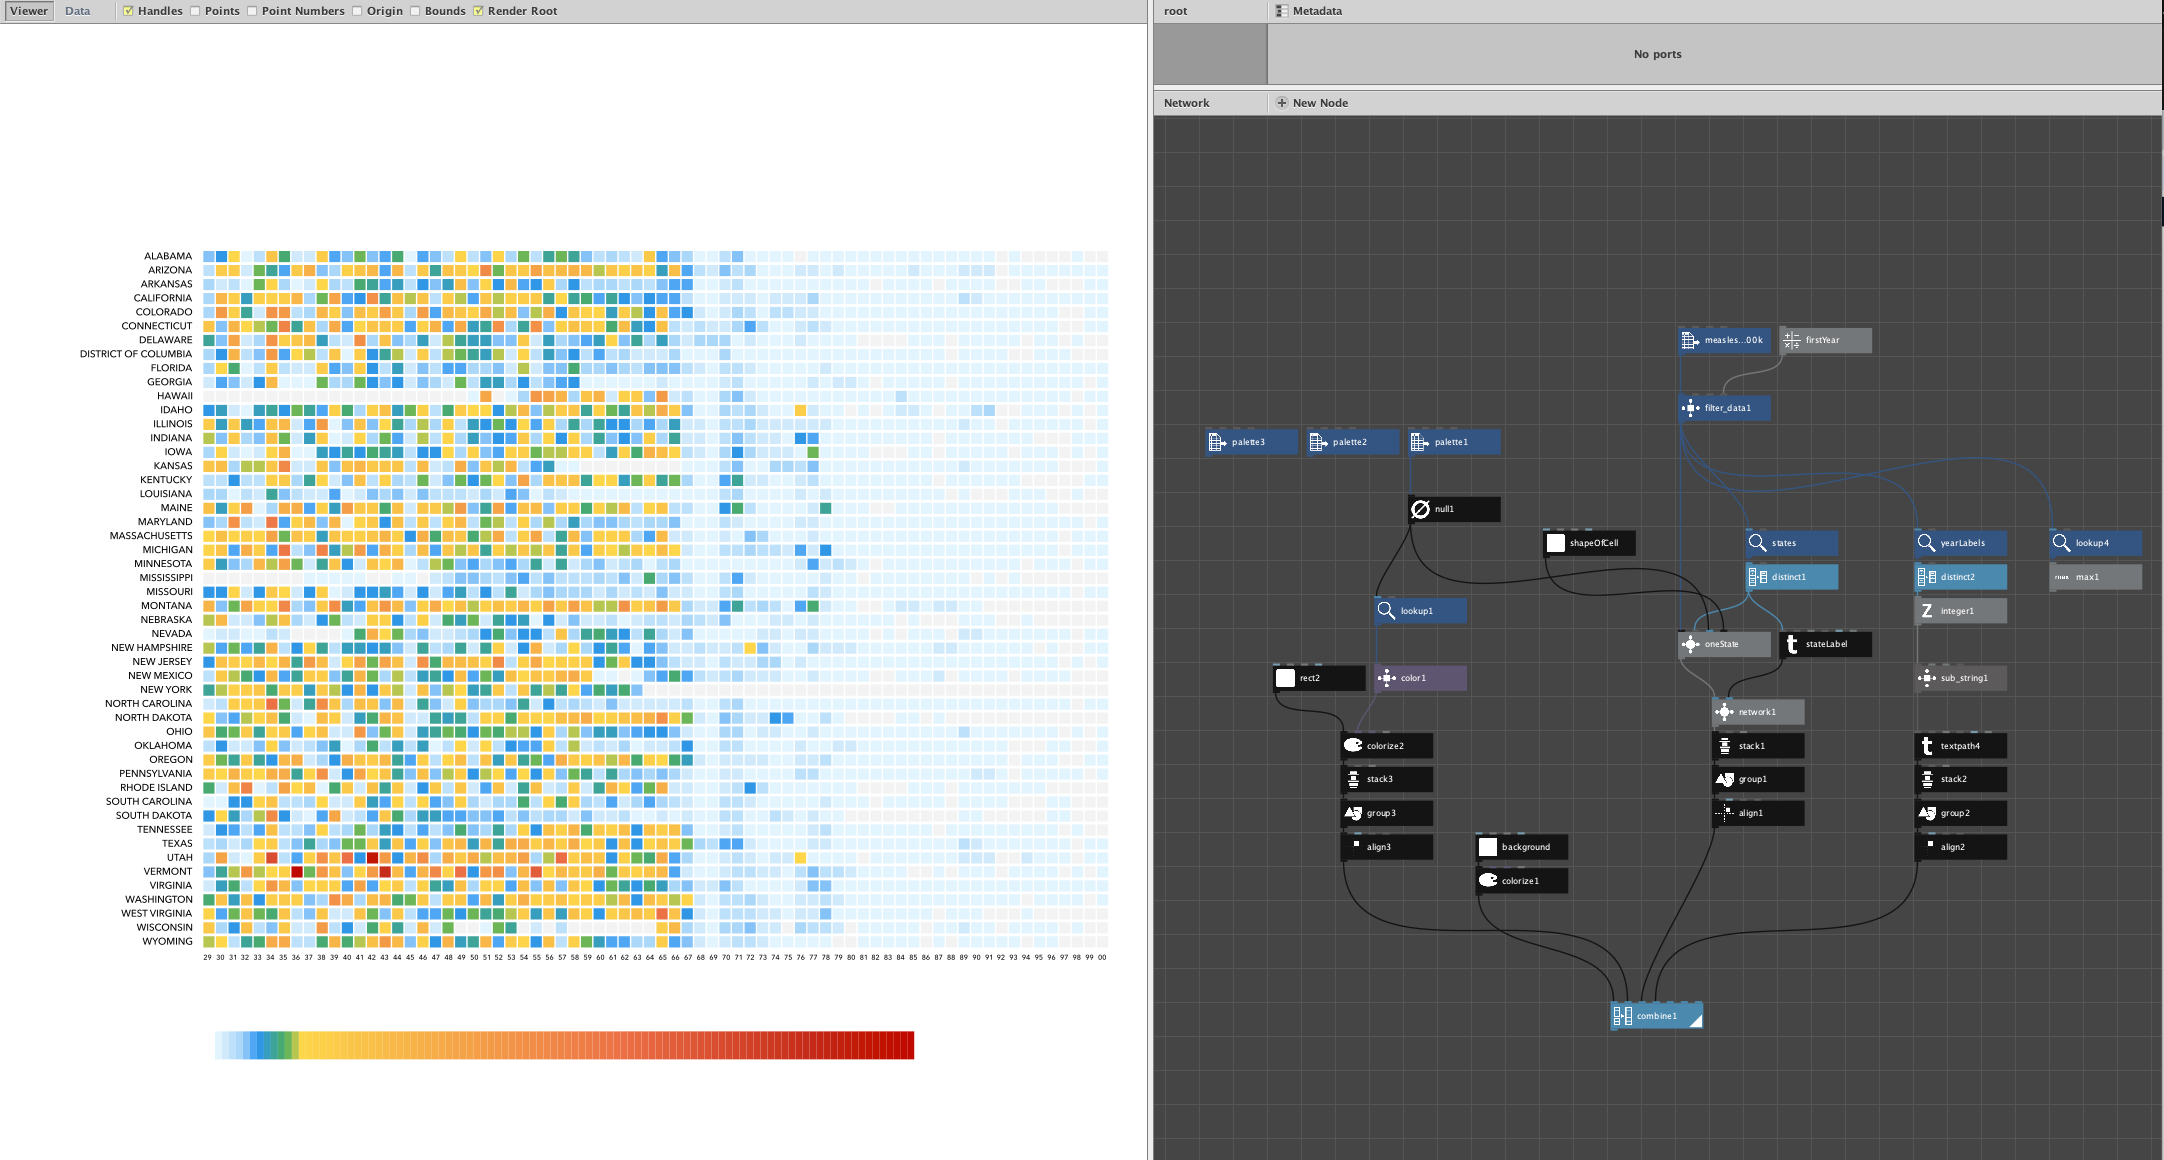
These vaccination charts are superb: beautiful, effective, clear, and illuminating. And a perfect fit for Nodebox.
Recreating charts like this is a great exercise. You learn about working with data, finding it, cleaning it, preparing it. You learn that the first 90% of the translation to shapes and colors is often fairly easy, but the final 10% (perfecting the labels and legends, choosing the perfect fonts, fine tuning the colors, etc.) takes much more time. It gives you an appreciation for master-level visualization.
Too often people are taught to lean on tools that do much of the work for you but herd you towards cookie-cutter solutions that all look alike and do a good but not great job. I think starting from a blank canvas and turning numbers into shapes from scratch opens the mind and allows the extra degrees of freedom necessary to achieve new forms of visualization perfect for the particular task at hand. Working with data the way potters work with clay is a great way to learn,
You did a fine job here capturing the essence of the visualization. If you're curious I could point out a few nodes from my library that would further simplify the task.
I hope you consider teaching your students about Nodebox and assigning them to find great visualizations and recreate them in Nodebox as you have done. If you send your students here I will be happy to help them if they get stuck.