The new NodeBox forum is live! Everything from support.nodebox.net moved here: sign in with the same email to pick up your old posts. Something not working? Write to forum-support@nodebox.net.
Hi!
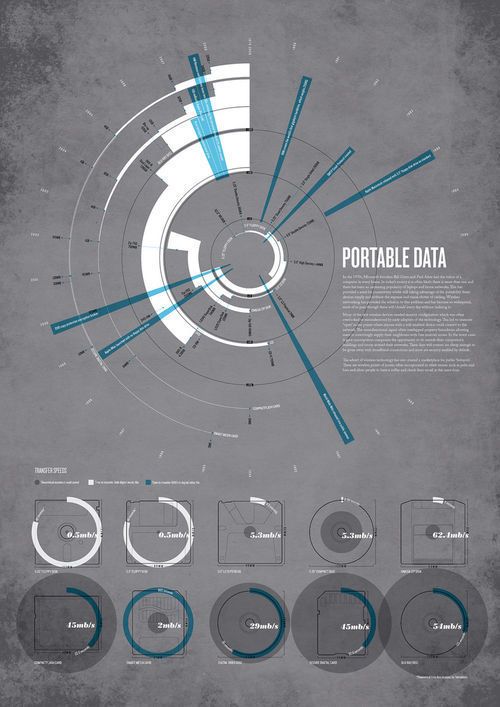
I was wondering if NB3 can be used to plot a Radial Chart type. It has several different names: radial tree, radial space filling etc.
I didn't found a discussion regarding this. I did found at data visualization tutorials the random pie example but its not quite it.
I send an image to illustrate my point.
If the answer is yes does anyone has posted a project to take a look at?
thanks in advance!
Pablo (from argentina)
JO
JOjohn
Hi Pablo,
Yes, NodeBox can definitely do radial charts. In fact NodeBox is particularly well suited to this type of chart. I've seen many such charts in the forum and have done several myself.
I think there are more out there. I suggest you give it a try in NodeBox. If you get stuck please post another note here and I will be glad to help.
John
AN
ANandy.treichler
NODEBOX 3 allows you to make with plenty of work to create radial charts. But it has its limitations and challenges. I made a year ago something. Maybe it gives you a hint.
But John is the Master of Nodebox! He helped me several times creating my solution. Important is the file you create to load the calculations. You are able to create the file with all the radius calculation in a csv or calculate them inside of Nodebox. I did the second one and calculated all from raw data. Hope it helps
Regards Andy
PA
PApablodespeluzzi
Thanks both of you Andy and John.
I will try to design it and will call for help if I get stuck (what it will probably occur haha)
Regards Pablo
Know something that helps?
Sign in with your email address to reply. No password needed.